1 基本概念
1 prometheus介绍
Prometheus 是一个开源的系统监控和报警工具,专为高效采集和存储时间序列数据而设计,目前广泛用于监控微服务架构、云基础设施和Kubernetes集群等环境。Prometheus的架构图如下。
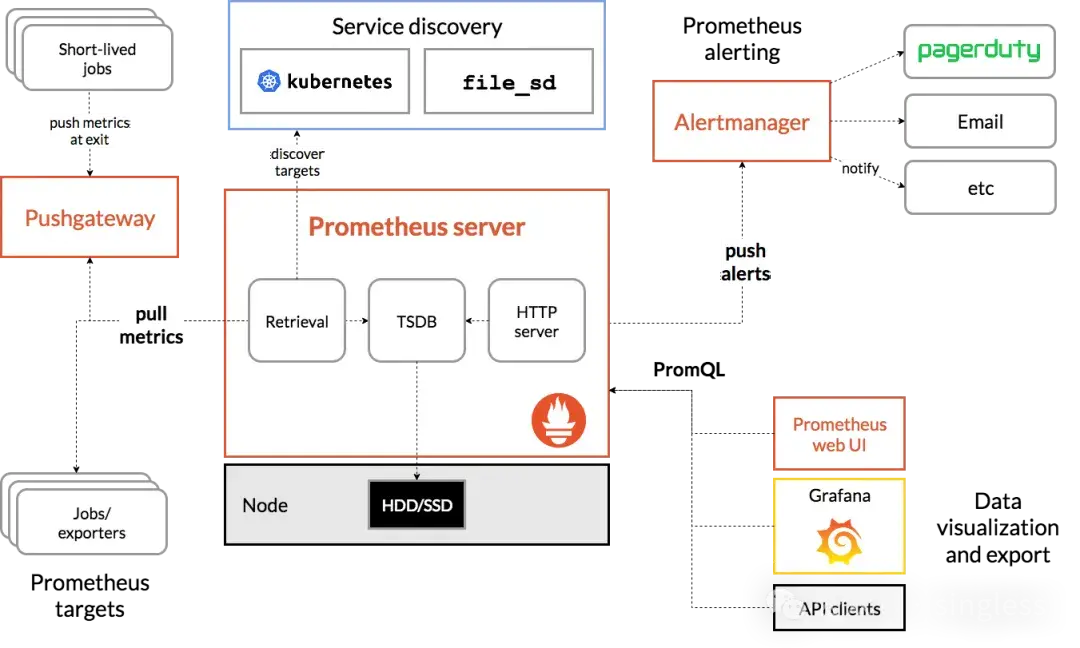
exporter可以理解为prometheus的客户端,作用是把从节点 ( 操作系统或应用服务或存储等) 中采集到的监控数据作为Metrics指标,再将Metrics指标以HTTP的方式暴露给Prometheus。常用的exporter有node exporter、mysql exporter等。
2 metrics介绍
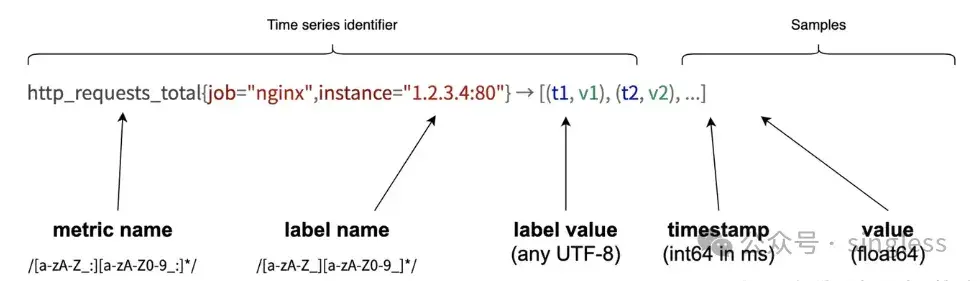
在Prometheus中,"metrics"(度量)是指系统或应用程序的性能数据或状态数据,这些数据以时间序列的形式存储,并用于监控和分析。Prometheus 的 metrics 数据模型是基于时间序列(time series)的,每个时间序列由以下几个部分组成:
- 指标名称 (Metric Name): 描述指标的名称。
- 标签 (Labels): 可选,一组键值对,用于标识同一指标的不同实例。
- 时间戳 (Timestamp): 可选的 Unix 时间戳,表示指标记录的时间点。
- 值 (Value): 指标的数值。
Metrics的数据模型如下图所示
3 metrics的类型
Prometheus的client libraries中目前提供了四种核心的Metrics类型Counter、Gauge、Histogram和Summary
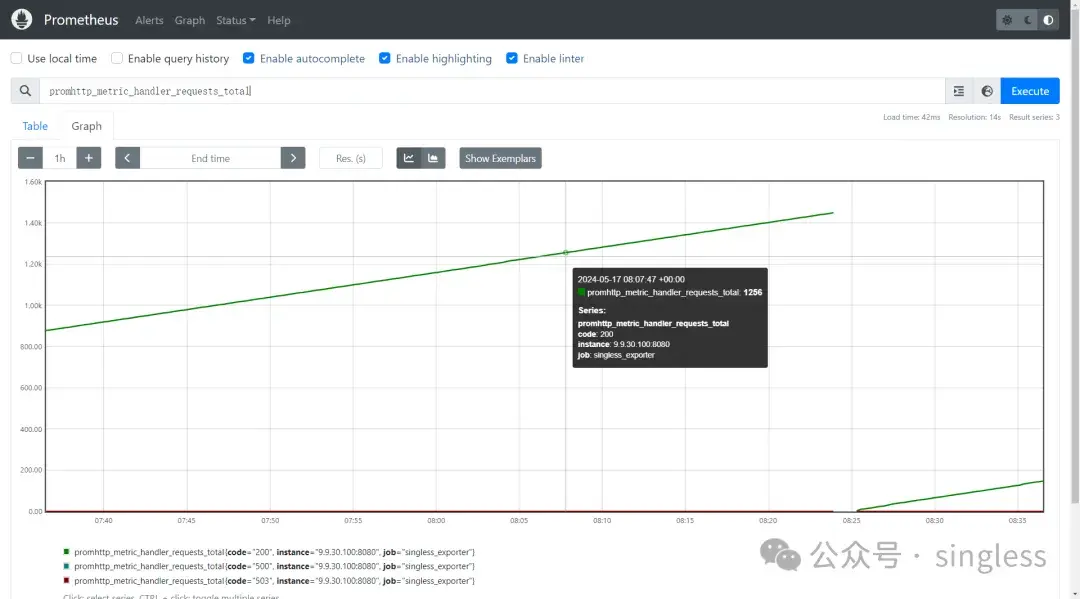
3.1 Counter类型
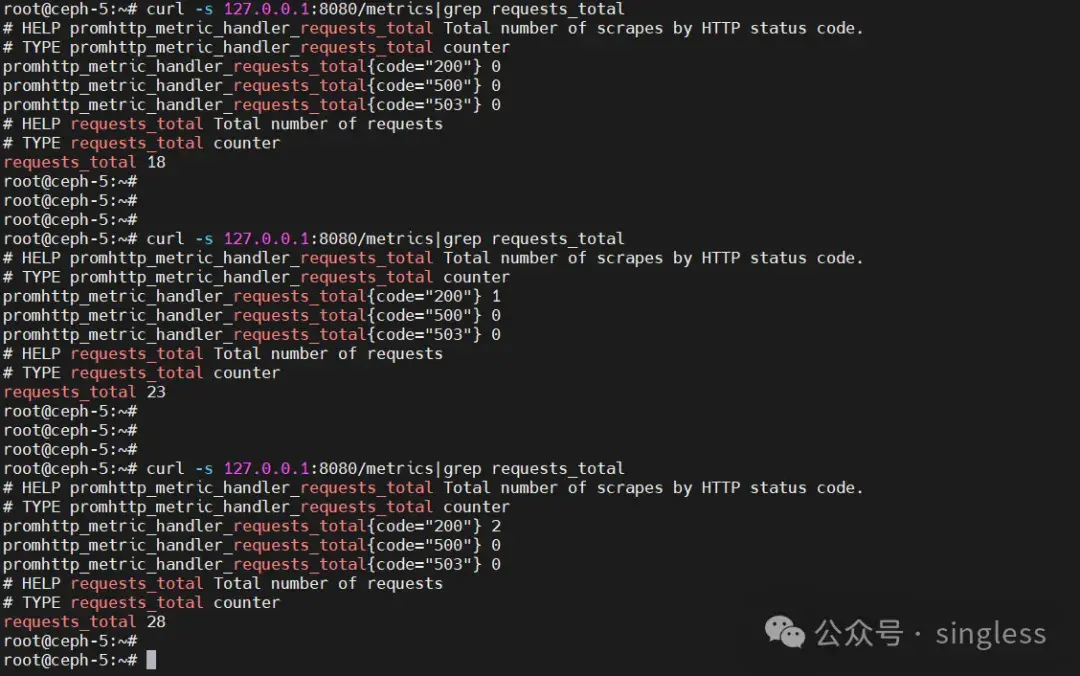
对于只会增加的数据,可以使用counter类型。counter是一个只增不减的计数器,除非重置,反映的是线性数据。它的值通常从零开始累加,例如可以用来表示promhttp_metric_handler_requests_total (/metrics的总请求数) 的值。
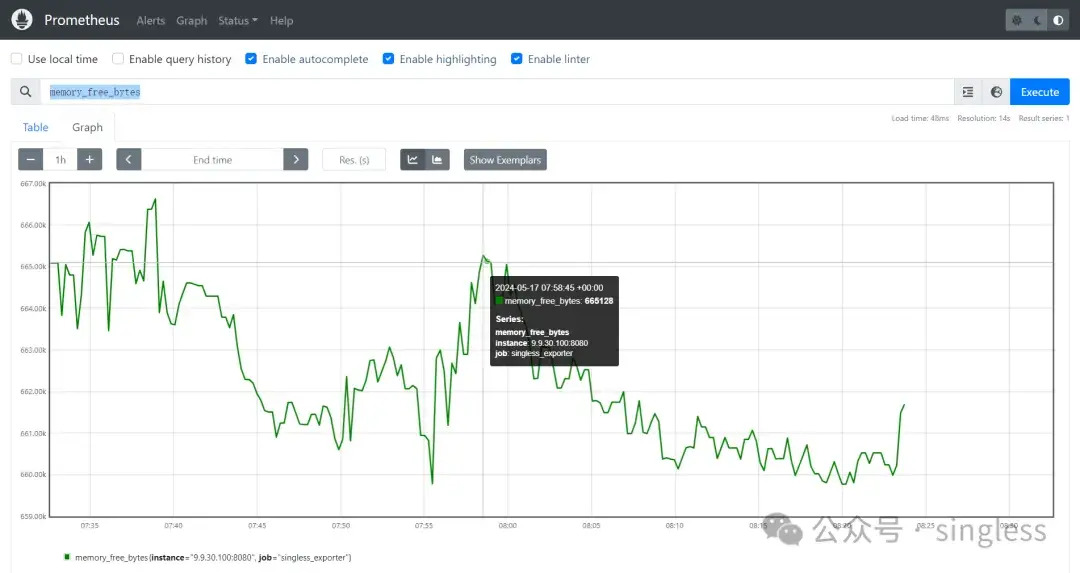
3.2Gauge类型
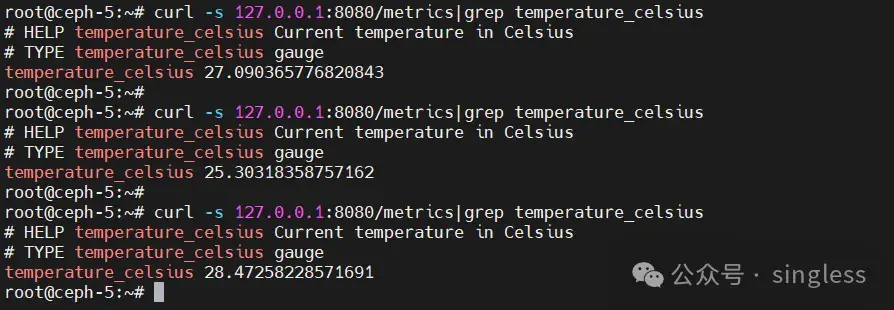
对于会增加也会减少的数据,可以使用Gauge类型。Gauge用来表示可增可减的数据,反映的是动态变化的数据。例如memory_free_bytes (节点剩余可用内存数)。
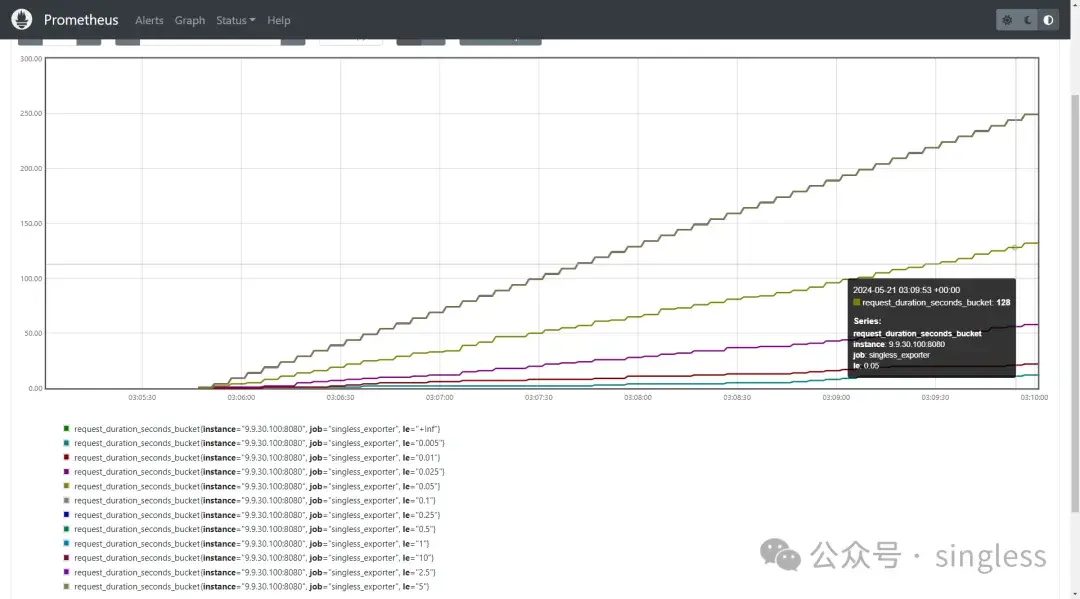
3.3 Histogram类型
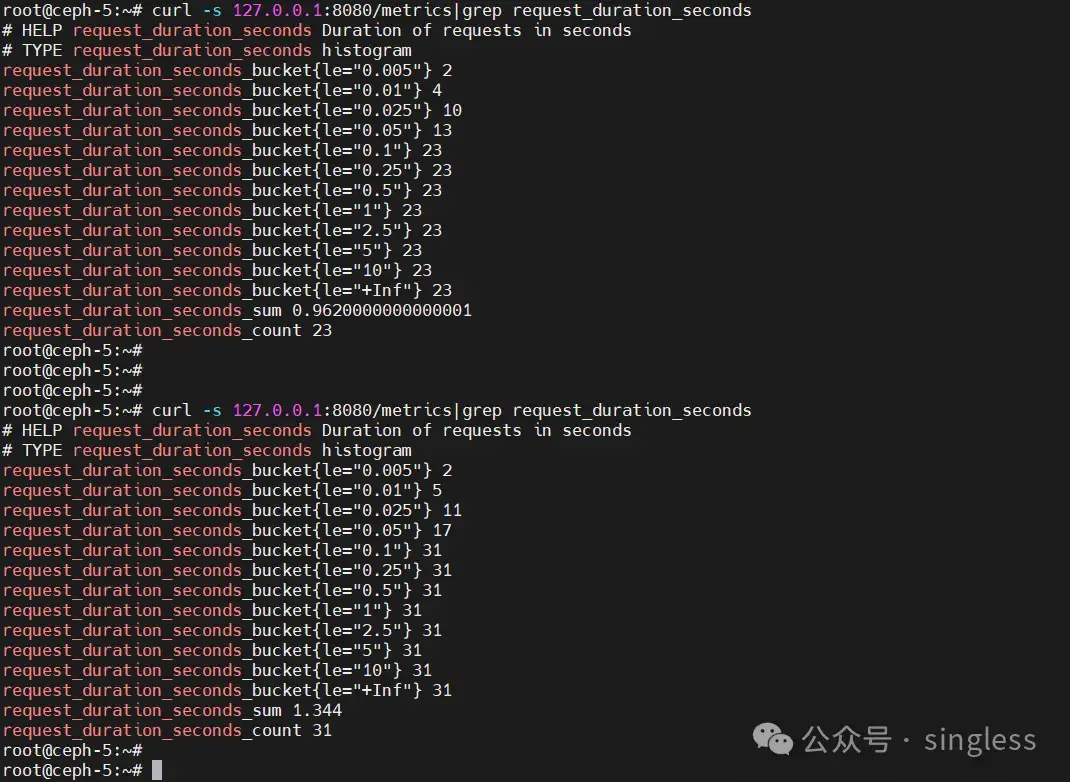
Histogram测量离散事件的分布。常见例子是 HTTP 请求的延迟、函数运行时或 I/O 请求大小。Histogram统计了指标的时序流历史样本点,输出在对应区间内样本点的数量。
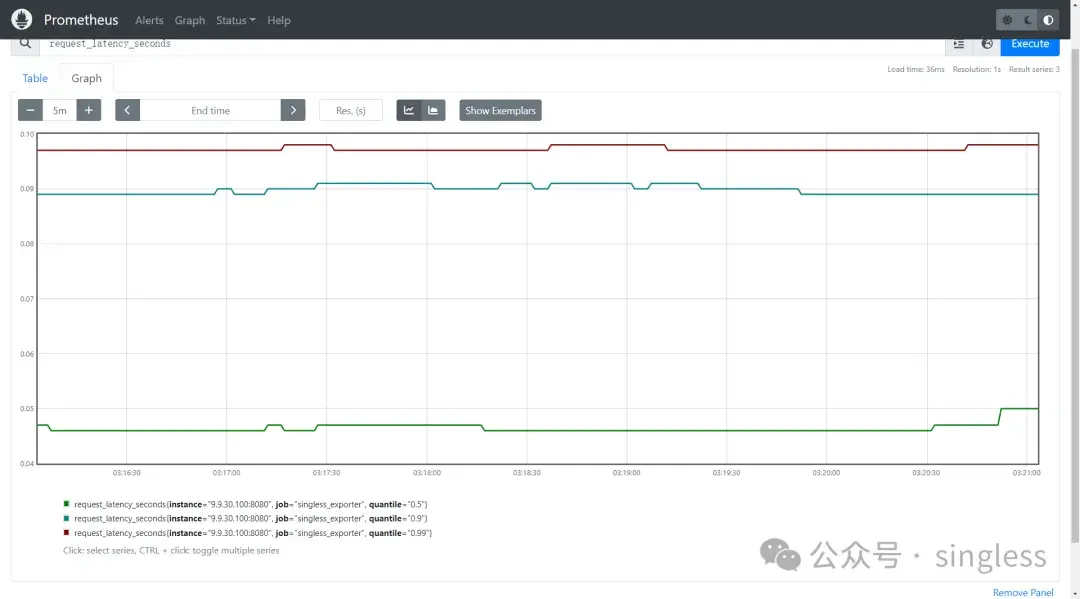
3.4 Summary类型
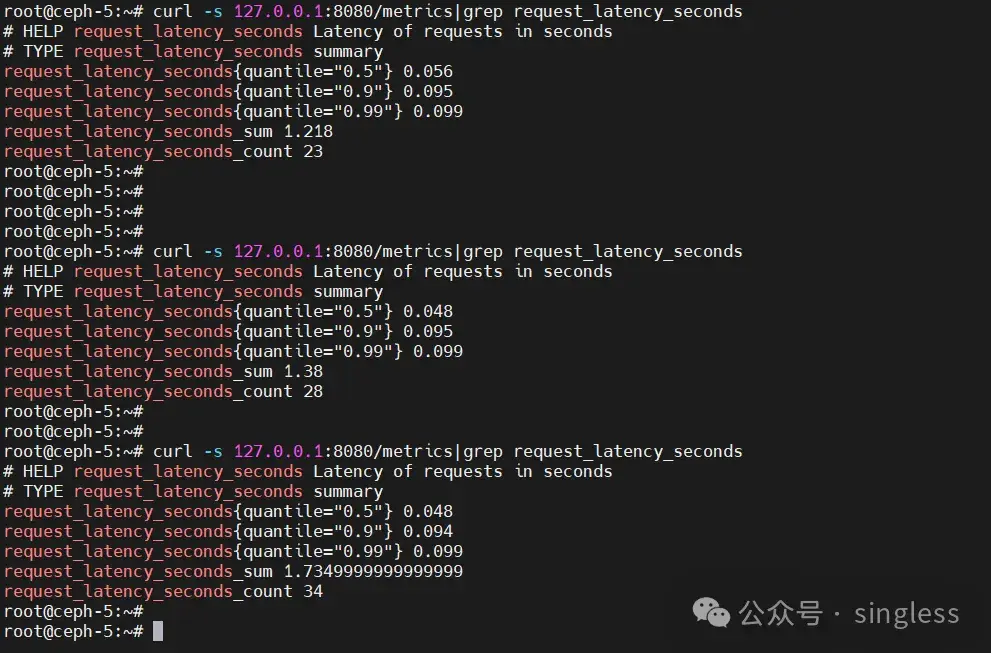
Summary也是测量离散事件的分布,不过引入了分位数的概念,能够输出指标的时序流历史中,指定分位数后的统计值。
4 使用go开发一个exporter
尽管官方和第三方已经提供了很多实用的exporter,但有时候我们仍然需要自己去开发exporter,因为自己的Prometheus Exporter可以根据应用和业务的特定需求来自定义和精细化监控指标,确保监控更准确。并且还能整合多种数据源,并灵活调整监控内容,适应复杂和变化的环境。开发步骤如下
- 根据开发语言下载好prometheus client库
- 创建metrics指标
- 给metrics指标赋值
- 注册metrics指标
- 通过http暴露metics指标
先来一个例子
package mainimport ("net/http""github.com/prometheus/client_golang/prometheus""github.com/prometheus/client_golang/prometheus/promhttp""log"
)// 定义自定义指标
var (httpRequestsTotal = prometheus.NewCounter(prometheus.CounterOpts{Name: "http_requests_total",Help: "Total number of HTTP requests.",})currentMemoryUsage = prometheus.NewGauge(prometheus.GaugeOpts{Name: "current_memory_usage_bytes",Help: "Current memory usage in bytes.",})
)func init() {// 注册自定义指标prometheus.MustRegister(httpRequestsTotal)prometheus.MustRegister(currentMemoryUsage)
}func main() {// 增加计数器httpRequestsTotal.Inc()// 设置仪表的值currentMemoryUsage.Set(512.0)// 暴露metricshttp.Handle("/metrics", promhttp.Handler())log.Println("Beginning to serve on port :8080")log.Fatal(http.ListenAndServe(":8080", nil))
}
运行代码,访问http://localhost:8080/metrics,可以查看到如下结果
# HELP current_memory_usage_bytes Current memory usage in bytes.
# TYPE current_memory_usage_bytes gauge
current_memory_usage_bytes 512
# HELP http_requests_total Total number of HTTP requests.
# TYPE http_requests_total counter
http_requests_total 1
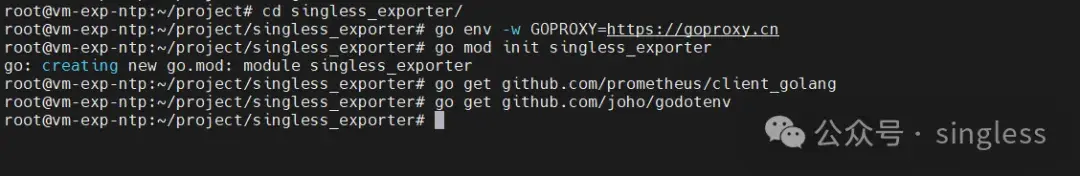
4.1 准备工作
先新建一个文件夹singless_exporter,再将go模块的安装源修改为国内源。进入singless_exporter文件夹,安装prometheus client相关库。go不能采用太老的版本,否则有些库或模块可能无法使用。
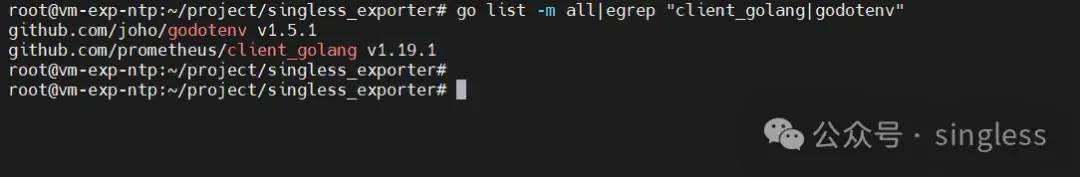
检查模块是否已成功安装
4.2 自定义指标
以下通过四段代码演示如何自定义Counter、Gauge、Histogram和Summary四种Metrics指标
- counter
package mainimport ("fmt""net/http""time""github.com/prometheus/client_golang/prometheus""github.com/prometheus/client_golang/prometheus/promhttp"
)func main() {// 创建一个 Counter 指标counter := prometheus.NewCounter(prometheus.CounterOpts{Name: "requests_total",Help: "Total number of requests",})// 注册指标prometheus.MustRegister(counter)// 给指标赋值。模拟请求,每秒递增计数器go func() {for {counter.Inc()time.Sleep(time.Second)}}()// 通过http暴露指标http.Handle("/metrics", promhttp.Handler())fmt.Println("Counter exporter is running on :8080/metrics")http.ListenAndServe(":8080", nil)
}
运行代码检查指标
- Gauge
package mainimport ("fmt""net/http""math/rand""time""github.com/prometheus/client_golang/prometheus""github.com/prometheus/client_golang/prometheus/promhttp"
)func main() {// 创建一个 Gauge 指标gauge := prometheus.NewGauge(prometheus.GaugeOpts{Name: "temperature_celsius",Help: "Current temperature in Celsius",})// 注册指标prometheus.MustRegister(gauge)// 模拟温度变化,每秒随机变化温度go func() {for {// 模拟随机温度值temperature := 20.0 + 10.0*rand.Float64()gauge.Set(temperature)time.Sleep(time.Second)}}()// 暴露指标http.Handle("/metrics", promhttp.Handler())fmt.Println("Gauge exporter is running on :8080/metrics")http.ListenAndServe(":8080", nil)
}
运行代码查看效果
- Histogram
package mainimport ("fmt""net/http""time""math/rand""github.com/prometheus/client_golang/prometheus""github.com/prometheus/client_golang/prometheus/promhttp"
)func main() {// 创建一个 Histogram 指标histogram := prometheus.NewHistogram(prometheus.HistogramOpts{Name:    "request_duration_seconds",Help:    "Duration of requests in seconds",Buckets: prometheus.DefBuckets, // 默认桶设置})// 注册指标prometheus.MustRegister(histogram)// 模拟请求,每秒随机生成请求持续时间并观察直方图go func() {for {duration := time.Duration(rand.Intn(100)) * time.Millisecondhistogram.Observe(duration.Seconds())time.Sleep(time.Second)}}()// 暴露指标http.Handle("/metrics", promhttp.Handler())fmt.Println("Histogram exporter is running on :8080/metrics")http.ListenAndServe(":8080", nil)
}
运行代码查看效果
- Summary
package mainimport ("fmt""net/http""time""math/rand""github.com/prometheus/client_golang/prometheus""github.com/prometheus/client_golang/prometheus/promhttp"
)func main() {// 创建一个 Summary 指标summary := prometheus.NewSummary(prometheus.SummaryOpts{Name:       "request_latency_seconds",Help:       "Latency of requests in seconds",Objectives: map[float64]float64{0.5: 0.05, 0.9: 0.01, 0.99: 0.001}, // 指定摘要目标})// 注册指标prometheus.MustRegister(summary)// 模拟请求,每秒随机生成请求持续时间并观察摘要go func() {for {duration := time.Duration(rand.Intn(100)) * time.Millisecondsummary.Observe(duration.Seconds())time.Sleep(time.Second)}}()// 暴露指标http.Handle("/metrics", promhttp.Handler())fmt.Println("Summary exporter is running on :8080/metrics")http.ListenAndServe(":8080", nil)
}
运行代码查看效果
4.3 通过http暴露指标
promhttp 包提供了有关 HTTP 服务器和客户端工具。可以通过创建http.Handler实例来达到以http协议暴露Prometheus指标的目的。
package mainimport ("net/http""github.com/prometheus/client_golang/prometheus/promhttp"
)func main()  {http.Handle("/metrics", promhttp.Handler())http.ListenAndServe(":8080", nil)
}
运行代码,访问localhost:8080/metrics可以看到默认的指标
5 实战案例
下面再通过一段代码演示如何获取Linux系统内存的total、used、free三个值
package mainimport ("fmt""os""strconv""strings""time""net/http""github.com/prometheus/client_golang/prometheus""github.com/prometheus/client_golang/prometheus/promhttp"
)// Define a custom Collector to collect memory metrics
type memoryCollector struct {totalMetric prometheus.GaugeusedMetric prometheus.GaugefreeMetric prometheus.Gaugetotal float64 // 新增字段,用于存储总内存值used float64 // 新增字段,用于存储已使用内存值free float64 // 新增字段,用于存储空闲内存值
}// Implement the Describe method for the Collector interface
func (c *memoryCollector) Describe(ch chan<- *prometheus.Desc) {c.totalMetric.Describe(ch)c.usedMetric.Describe(ch)c.freeMetric.Describe(ch)
}// Implement the Collect method for the Collector interface
func (c *memoryCollector) Collect(ch chan<- prometheus.Metric) {// Open /proc/meminfo filefile, err := os.Open("/proc/meminfo")if err != nil {fmt.Println("Error opening /proc/meminfo:", err)return}defer file.Close()// Read memory info from filebuf := make([]byte, 1024)n, err := file.Read(buf)if err != nil {fmt.Println("Error reading /proc/meminfo:", err)return}// Parse memory infolines := strings.Split(string(buf[:n]), "\n")for _, line := range lines {fields := strings.Fields(line)if len(fields) < 3 {continue}switch fields[0] {case "MemTotal:":total, err := strconv.ParseFloat(fields[1], 64)if err != nil {fmt.Println("Error parsing MemTotal:", err)continue}c.total = totalc.totalMetric.Set(total)case "MemFree:":free, err := strconv.ParseFloat(fields[1], 64)if err != nil {fmt.Println("Error parsing MemFree:", err)continue}c.free = freec.freeMetric.Set(free)case "MemAvailable:":available, err := strconv.ParseFloat(fields[1], 64)if err != nil {fmt.Println("Error parsing MemAvailable:", err)continue}// Calculate used memory as total - availablec.used = c.total - availablec.usedMetric.Set(c.used)}}// Collect metricsc.totalMetric.Collect(ch)c.usedMetric.Collect(ch)c.freeMetric.Collect(ch)
}func main() {// Create new memoryCollectormemory := &memoryCollector{totalMetric: prometheus.NewGauge(prometheus.GaugeOpts{Name: "memory_total_bytes",Help: "Total memory in bytes",}),usedMetric: prometheus.NewGauge(prometheus.GaugeOpts{Name: "memory_used_bytes",Help: "Used memory in bytes",}),freeMetric: prometheus.NewGauge(prometheus.GaugeOpts{Name: "memory_free_bytes",Help: "Free memory in bytes",}),}// Register the memoryCollector with Prometheusprometheus.MustRegister(memory)// Create a new ServeMuxmux := http.NewServeMux()// Register the Prometheus handler to the /metrics endpointmux.Handle("/metrics", promhttp.Handler())// Start HTTP server to expose metricshttpServer := &http.Server{Addr: ":8080",ReadTimeout: 10 * time.Second,WriteTimeout: 10 * time.Second,Handler: mux, // Use the custom ServeMux}go func() {if err := httpServer.ListenAndServe(); err != nil {fmt.Println("Error starting HTTP server:", err)}}()fmt.Println("Memory exporter is running on :8080/metrics")// Keep the program runningselect {}
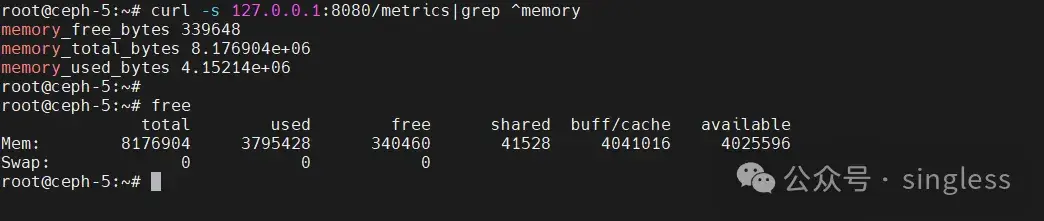
}运行代码后,输入端口号,可以看到内存相关信息
关注公众号 singless,获取更多有价值的文章


)

等)


