prometheus官网
grafana
软件下载
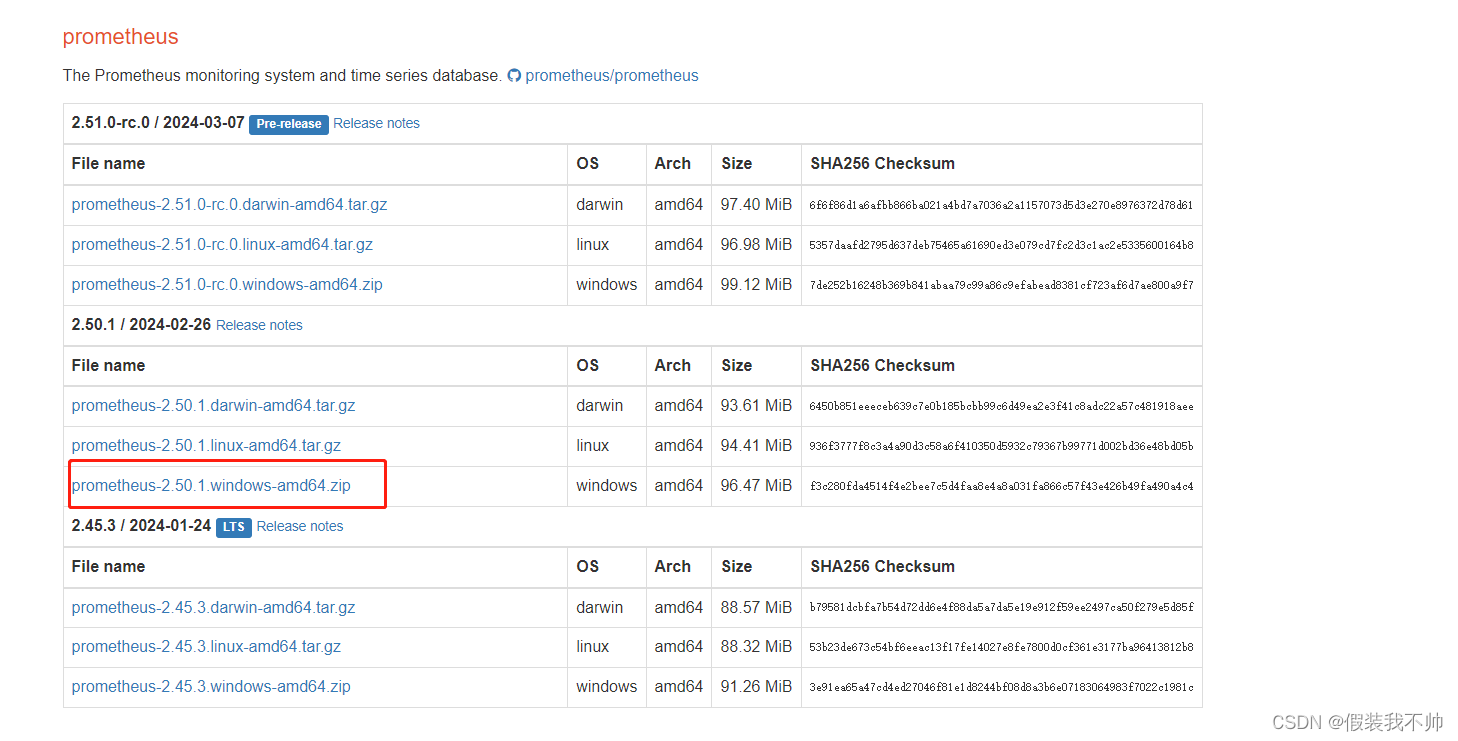
prometheus
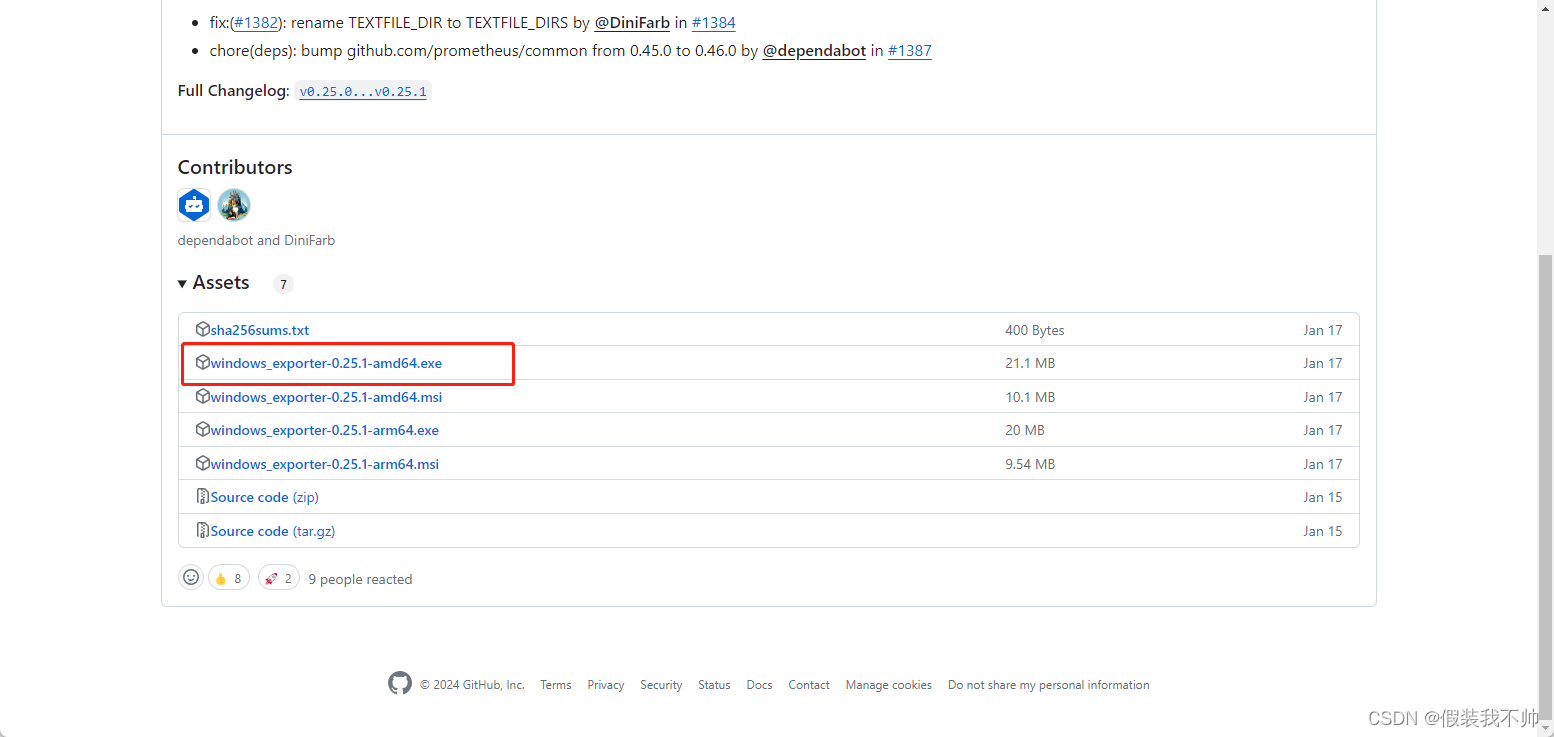
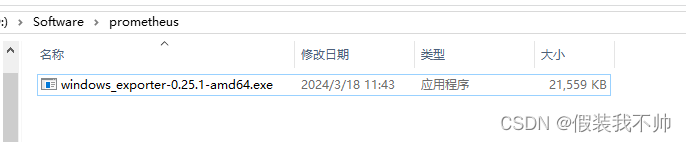
windows_exporter
https://github.com/prometheus-community/windows_exporter
grafana
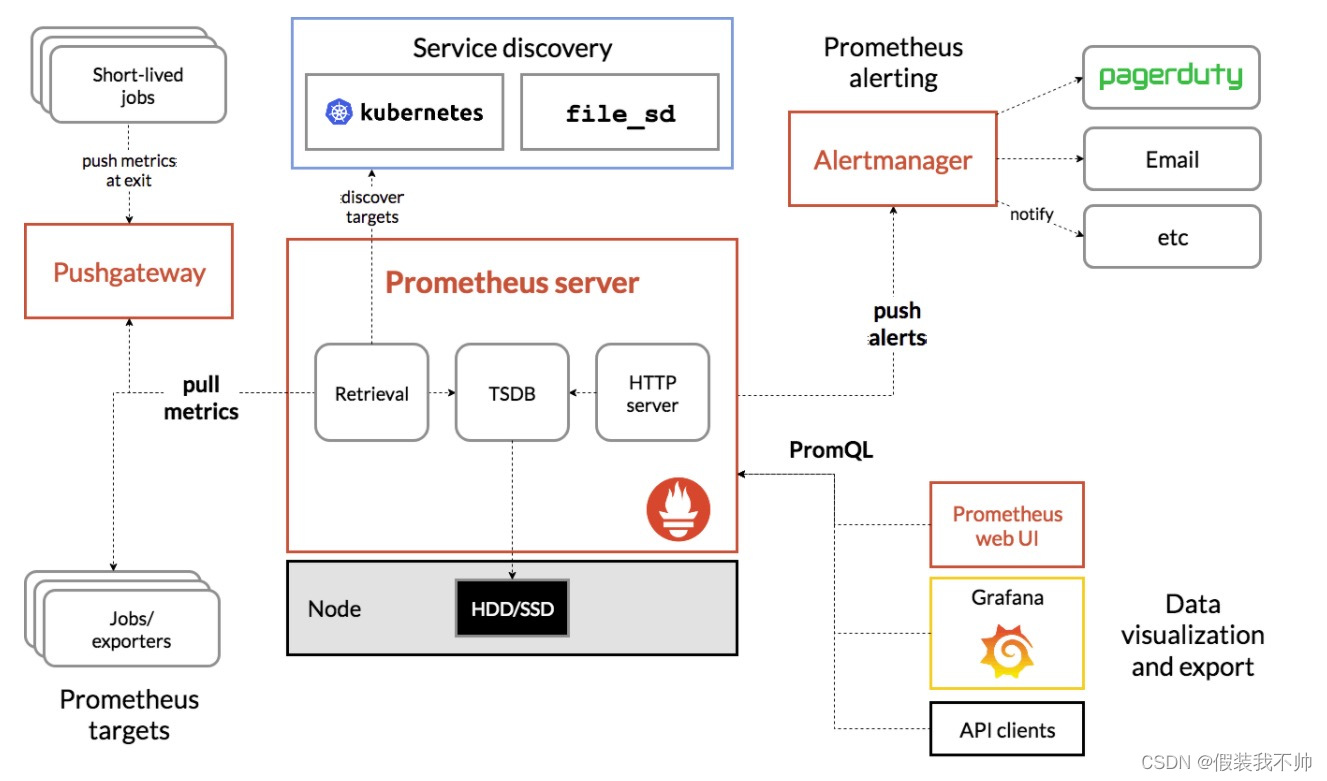
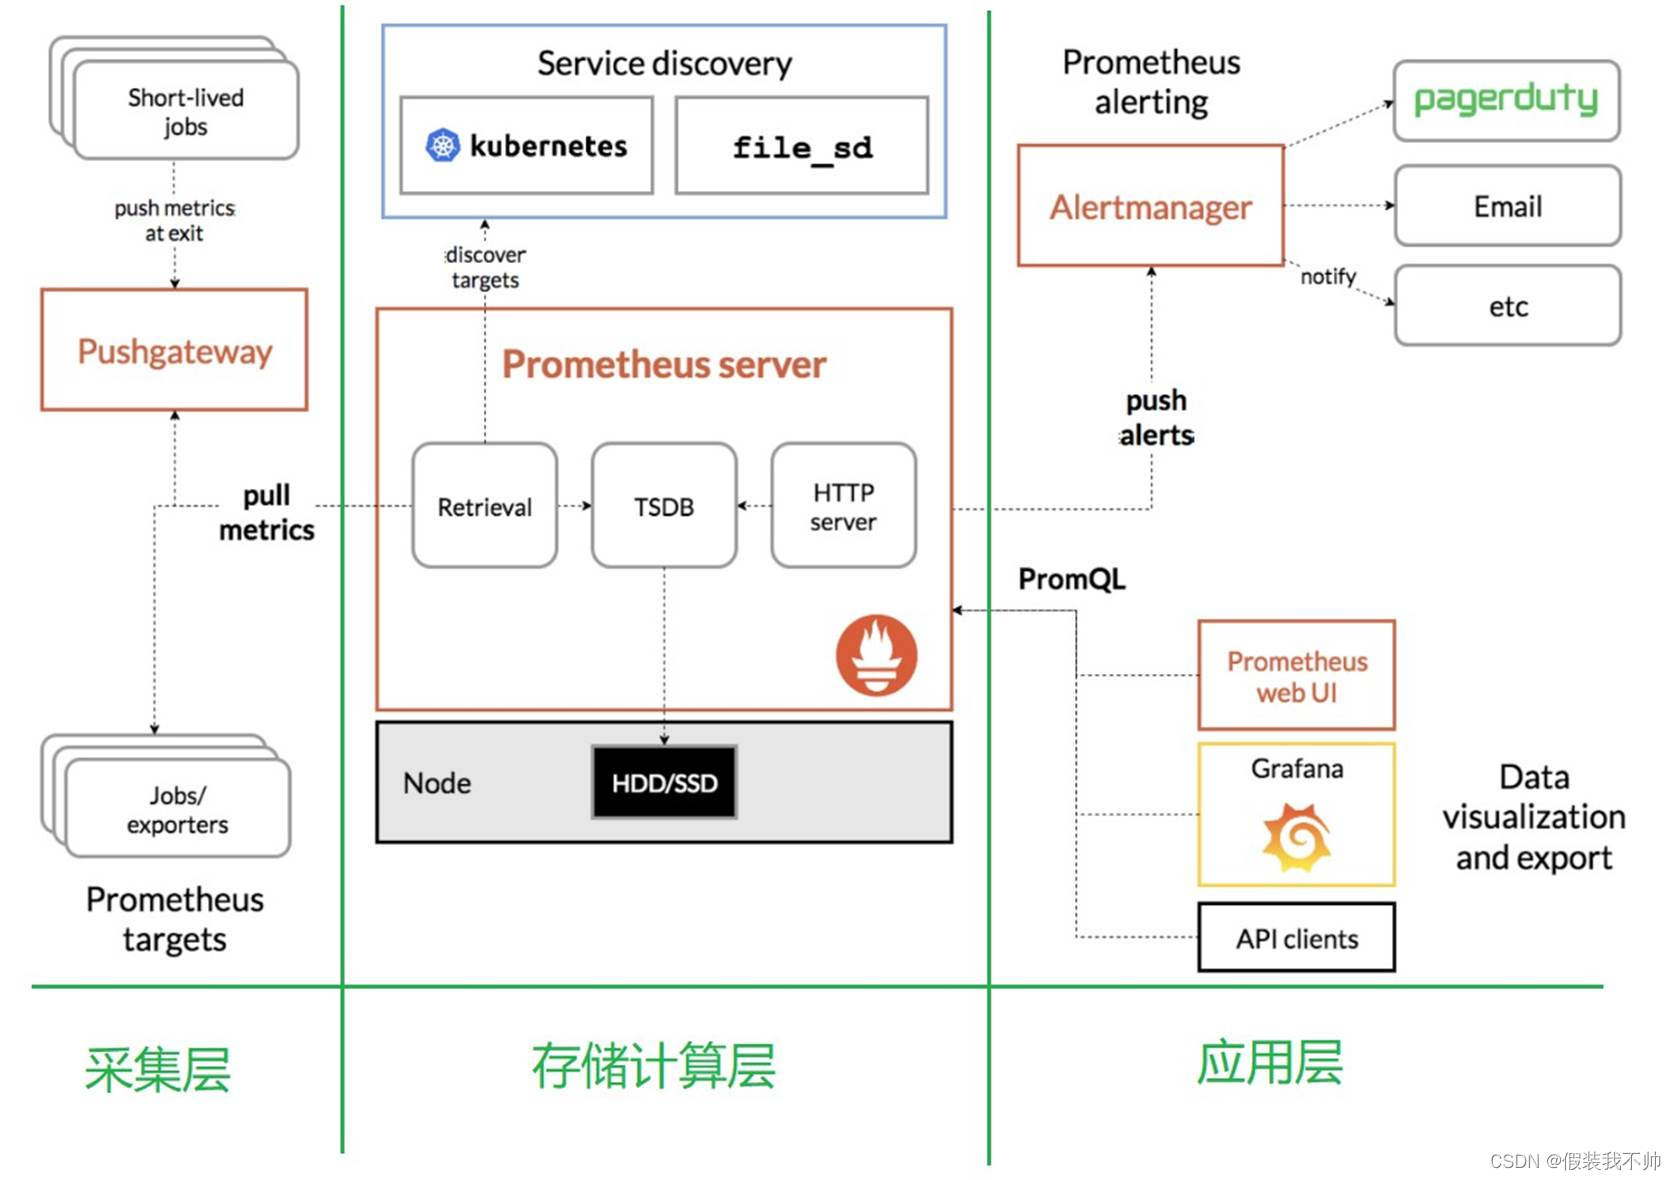
prometheus原理
配置prometheus
解压之后prometheus-2.50.1.windows-amd64.zip修改prometheus.yml
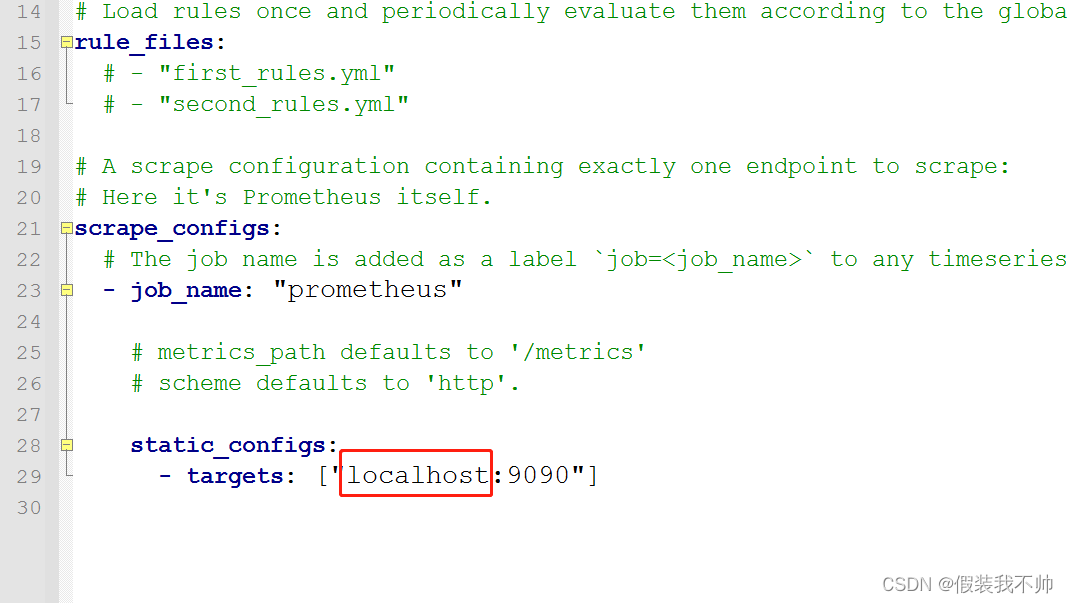
localhost修改为127.0.0.1
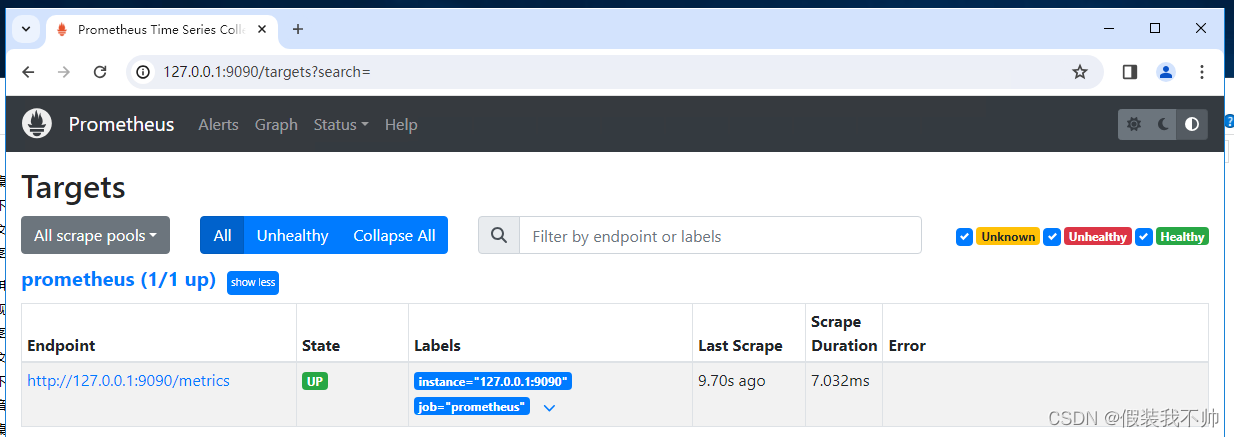
双击prometheus.exe运行
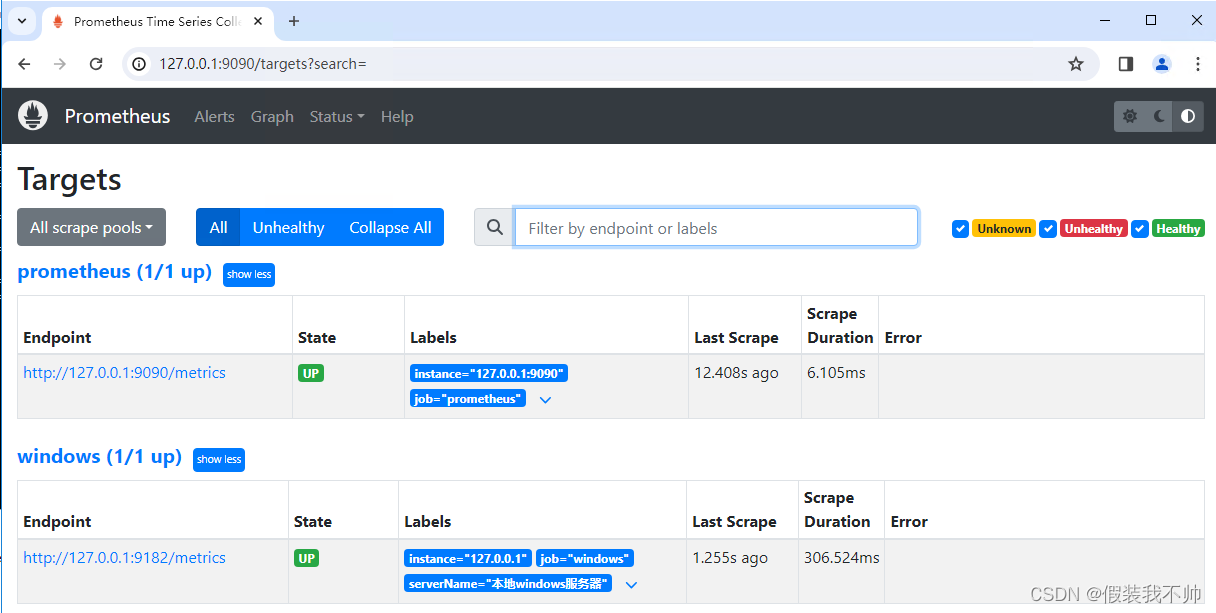
访问http://127.0.0.1:9090/targets
配置windows资源采集器
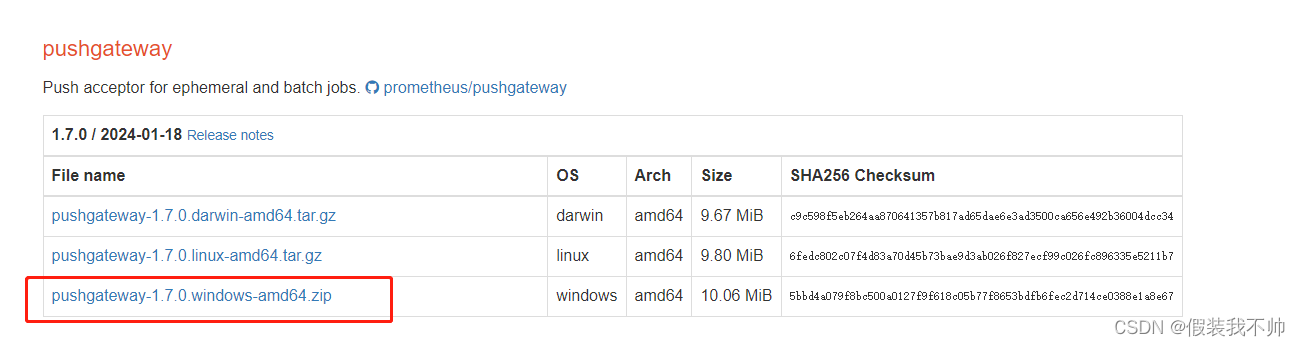
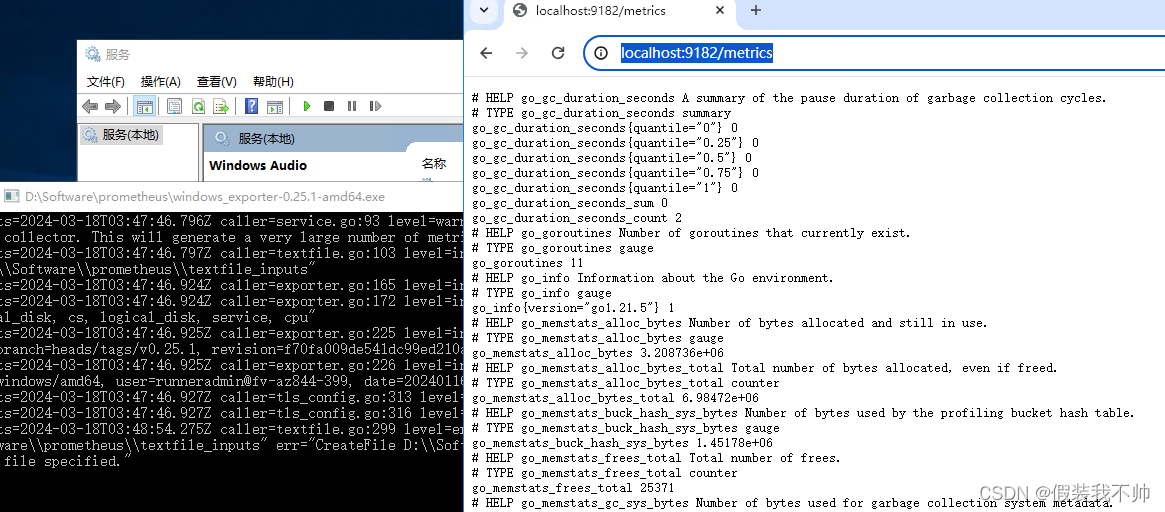
以管理员身份运行windows_exporter-0.25.1-amd64
访问http://localhost:9182/metrics
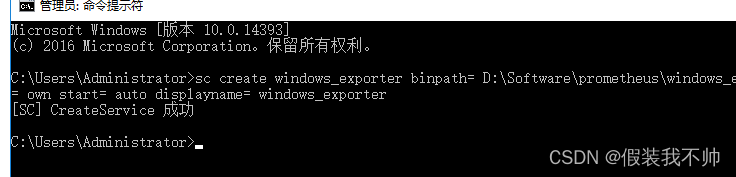
创建服务,以管理员身份启动cmd
sc create windows_exporter binpath= D:\Software\prometheus\windows_exporter-0.25.1-amd64.exe type= own start= auto displayname= windows_exporter
找到服务启动即可

删除服务
sc delete windows_exporter
在prometheus.yml同级目录新建windows.yml
- targets: ["127.0.0.1:9182"]labels:instance: 127.0.0.1serverName: '本地windows服务器'
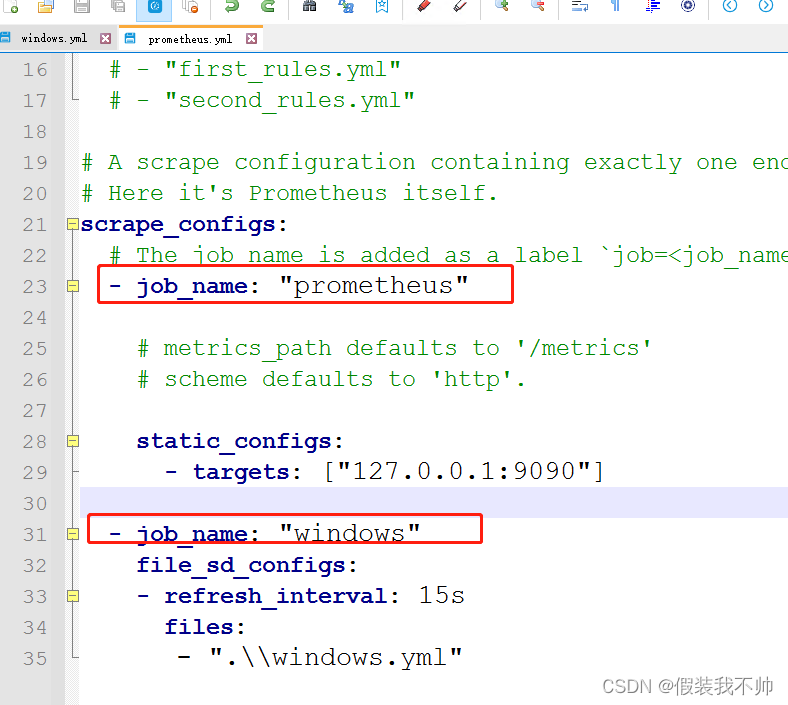
prometheus.yml中添加如下内容 (注意缩进)
- job_name: "windows"file_sd_configs:- refresh_interval: 15sfiles: - ".\\windows.yml"
重启prometheus端,打开http://127.0.0.1:9090/targets,windows状态为up即成功
配置Grafana
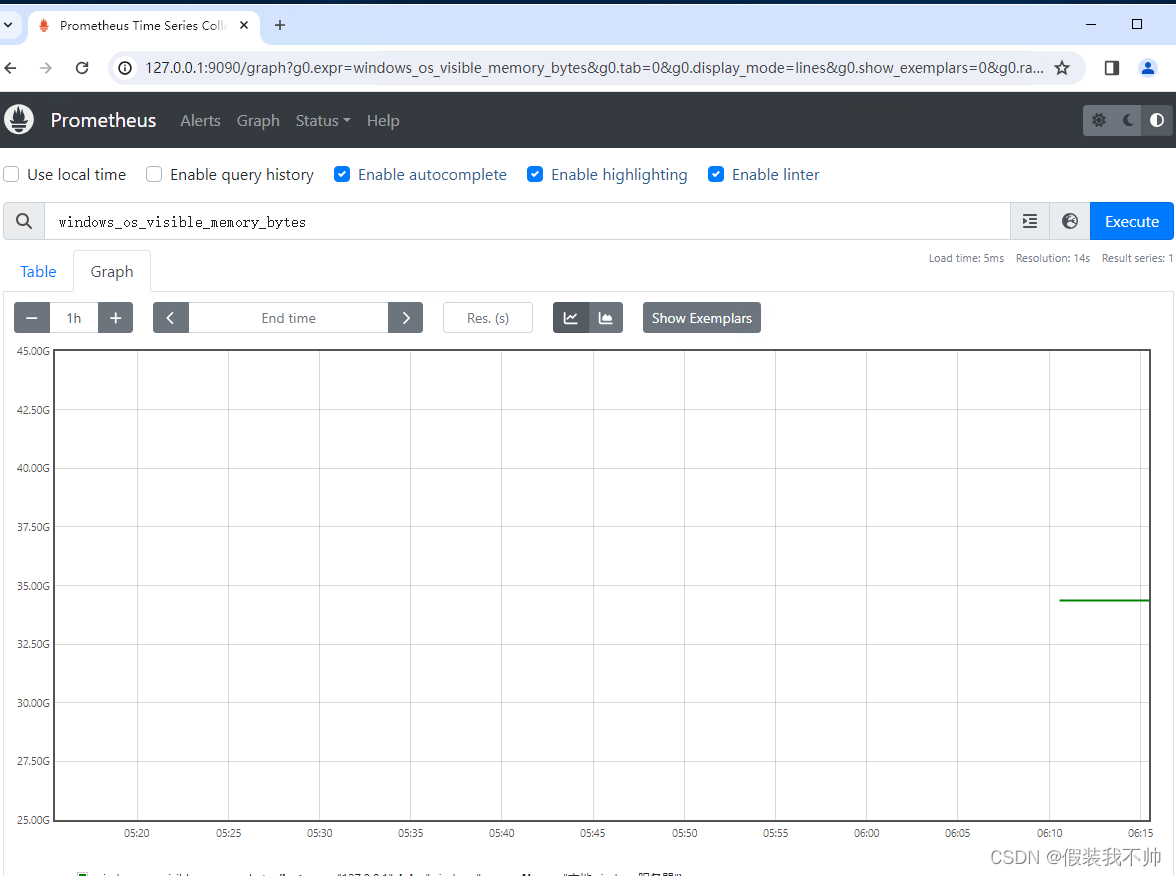
可以看到prometheus的默认界面比较单一,可看到的关键资源信息不多,下面使用Grafana展示具体资源状况
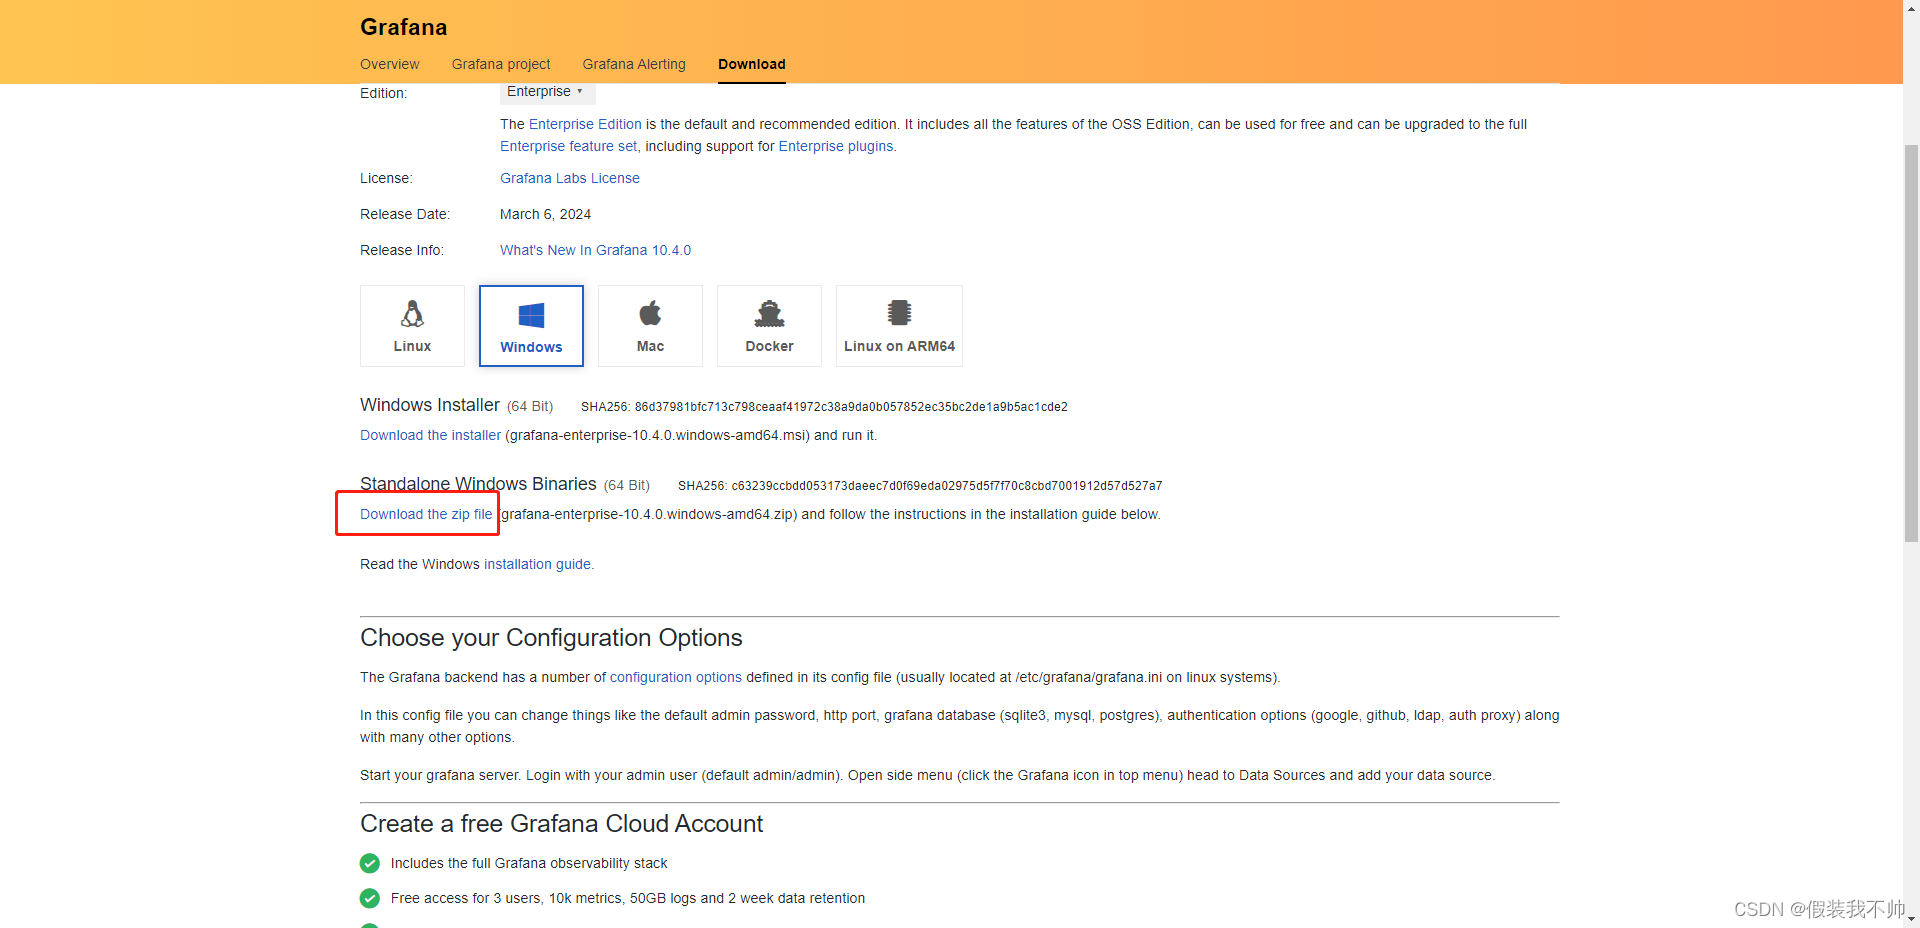
在全英文路径下解压grafana-enterprise-10.4.0.windows-amd64.zip,双击bin目录下grafana-server.exe,任务栏会新增一个黑窗户(不要关闭)
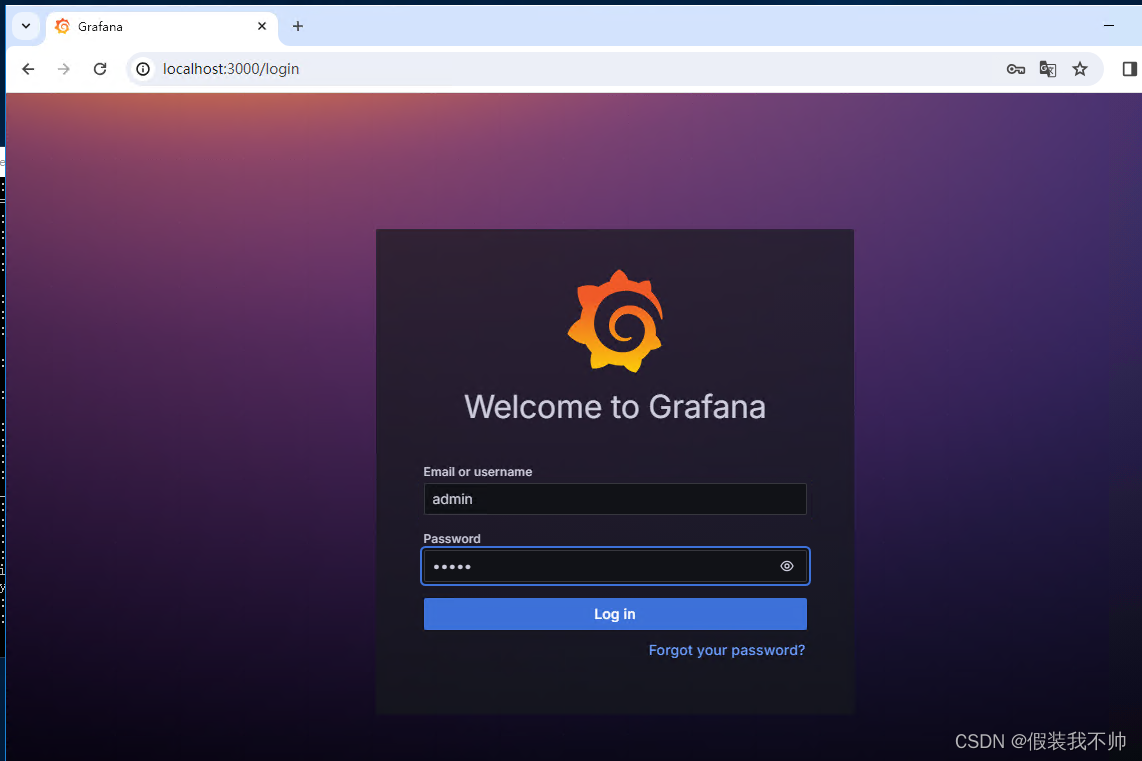
浏览器打开http://127.0.0.1:3000(默认账号密码都是admin)
第一次访问端口被占用,关闭占用的应用程序

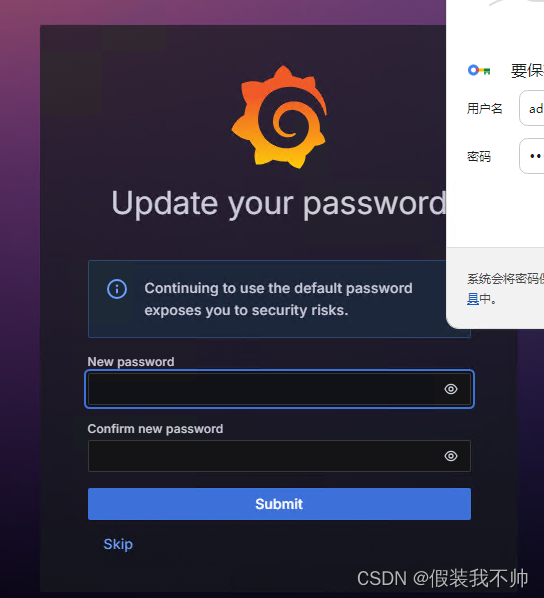
然后让输入新的密码
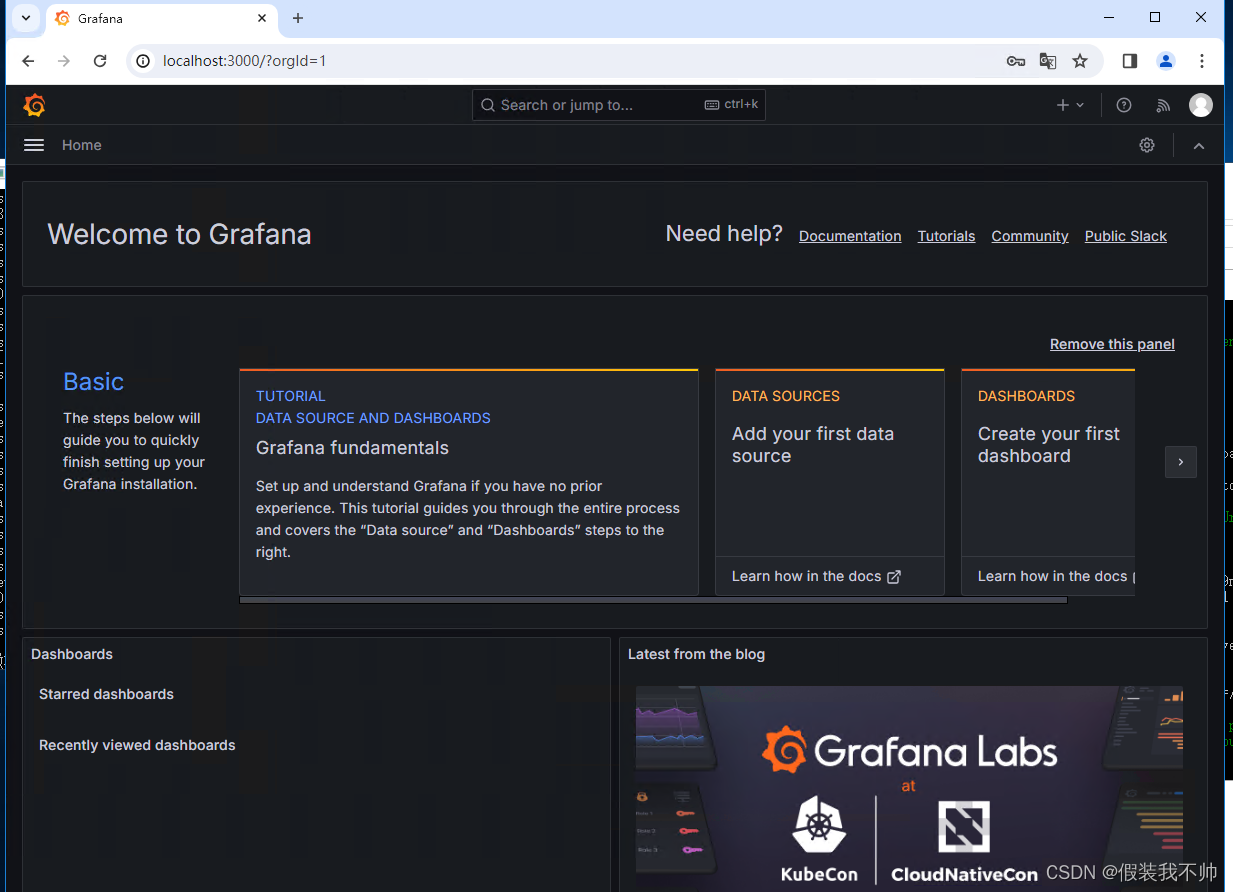
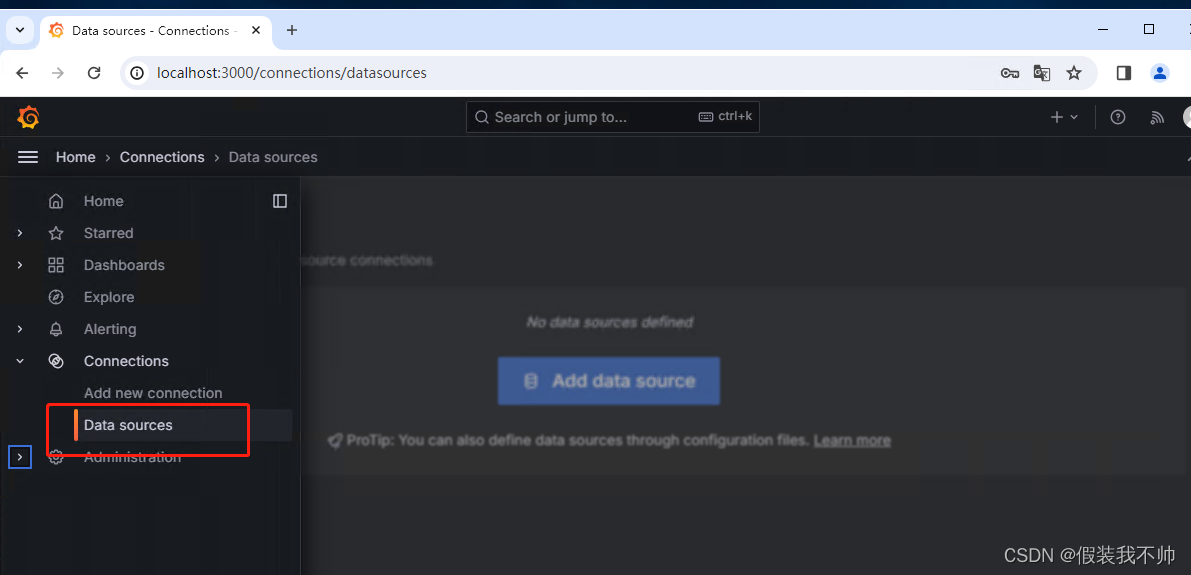
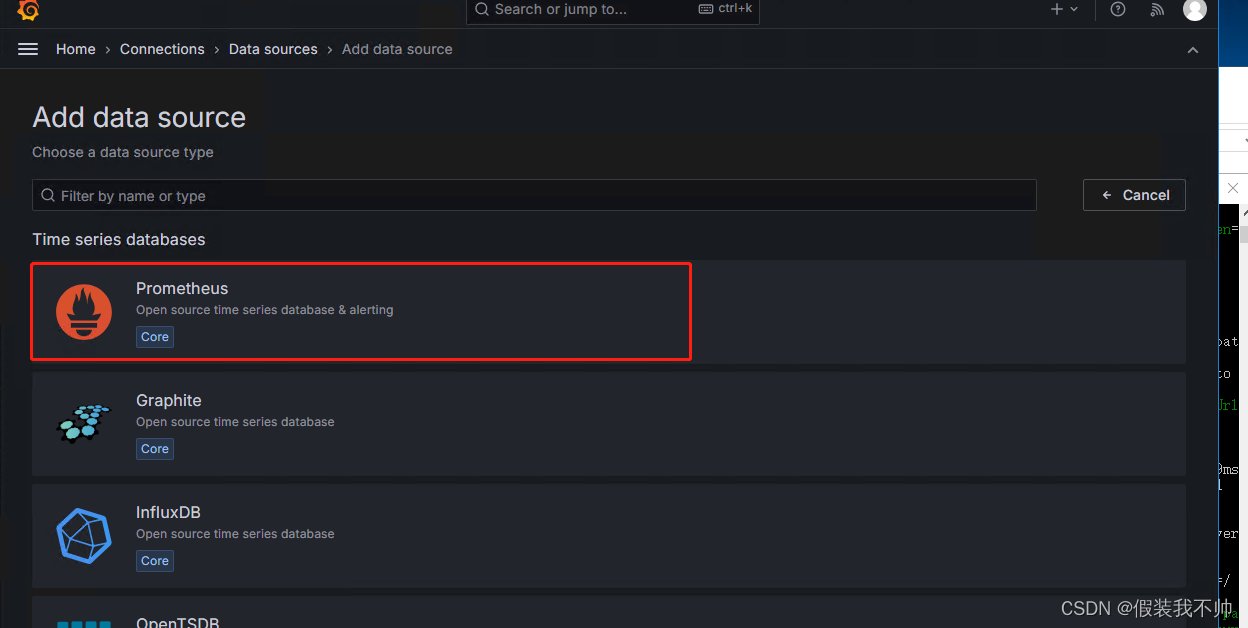
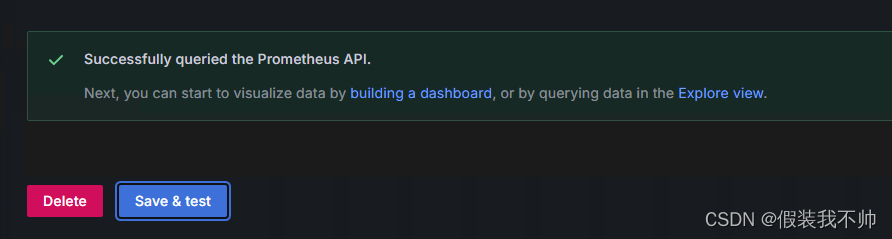
安装成功,创建数据源,关联prometheus端
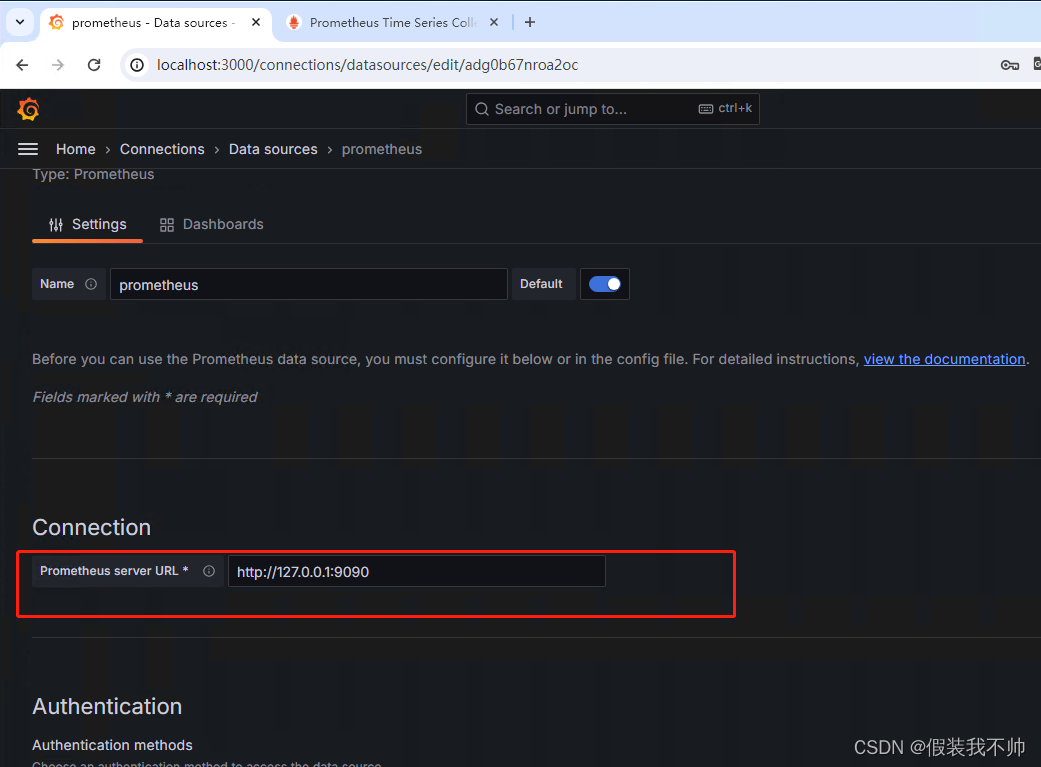
输入url其他默认即可
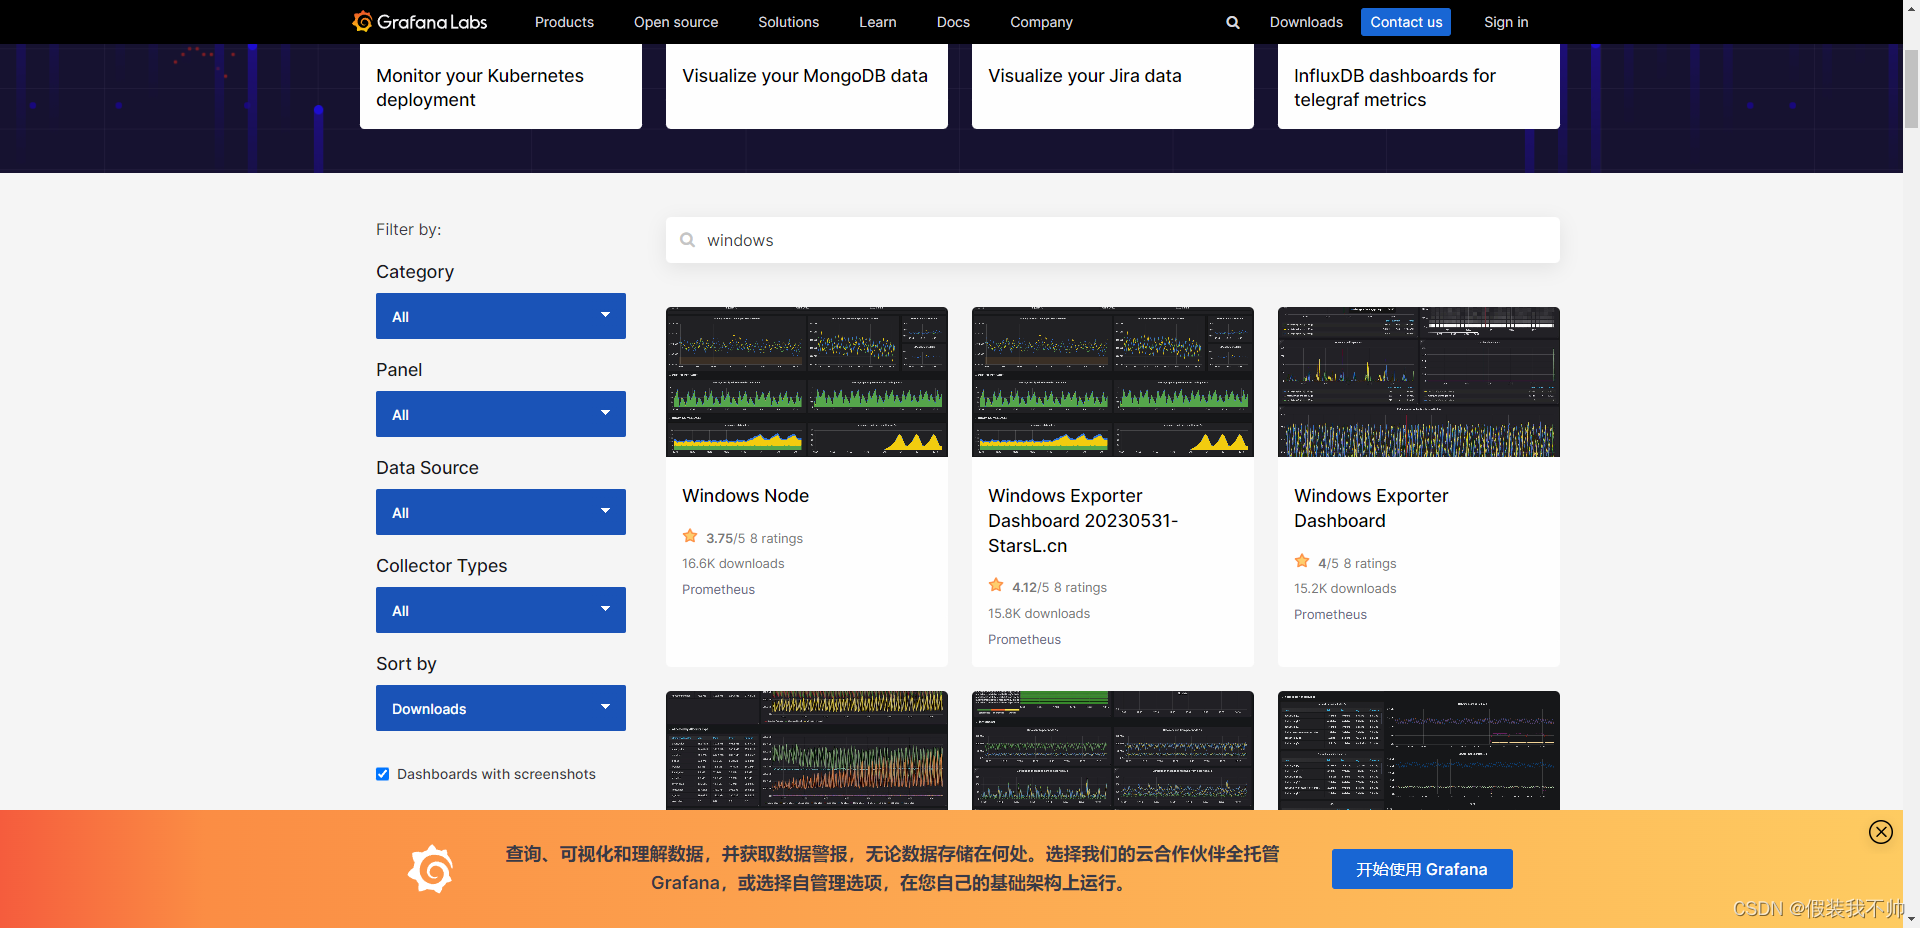
选择模板
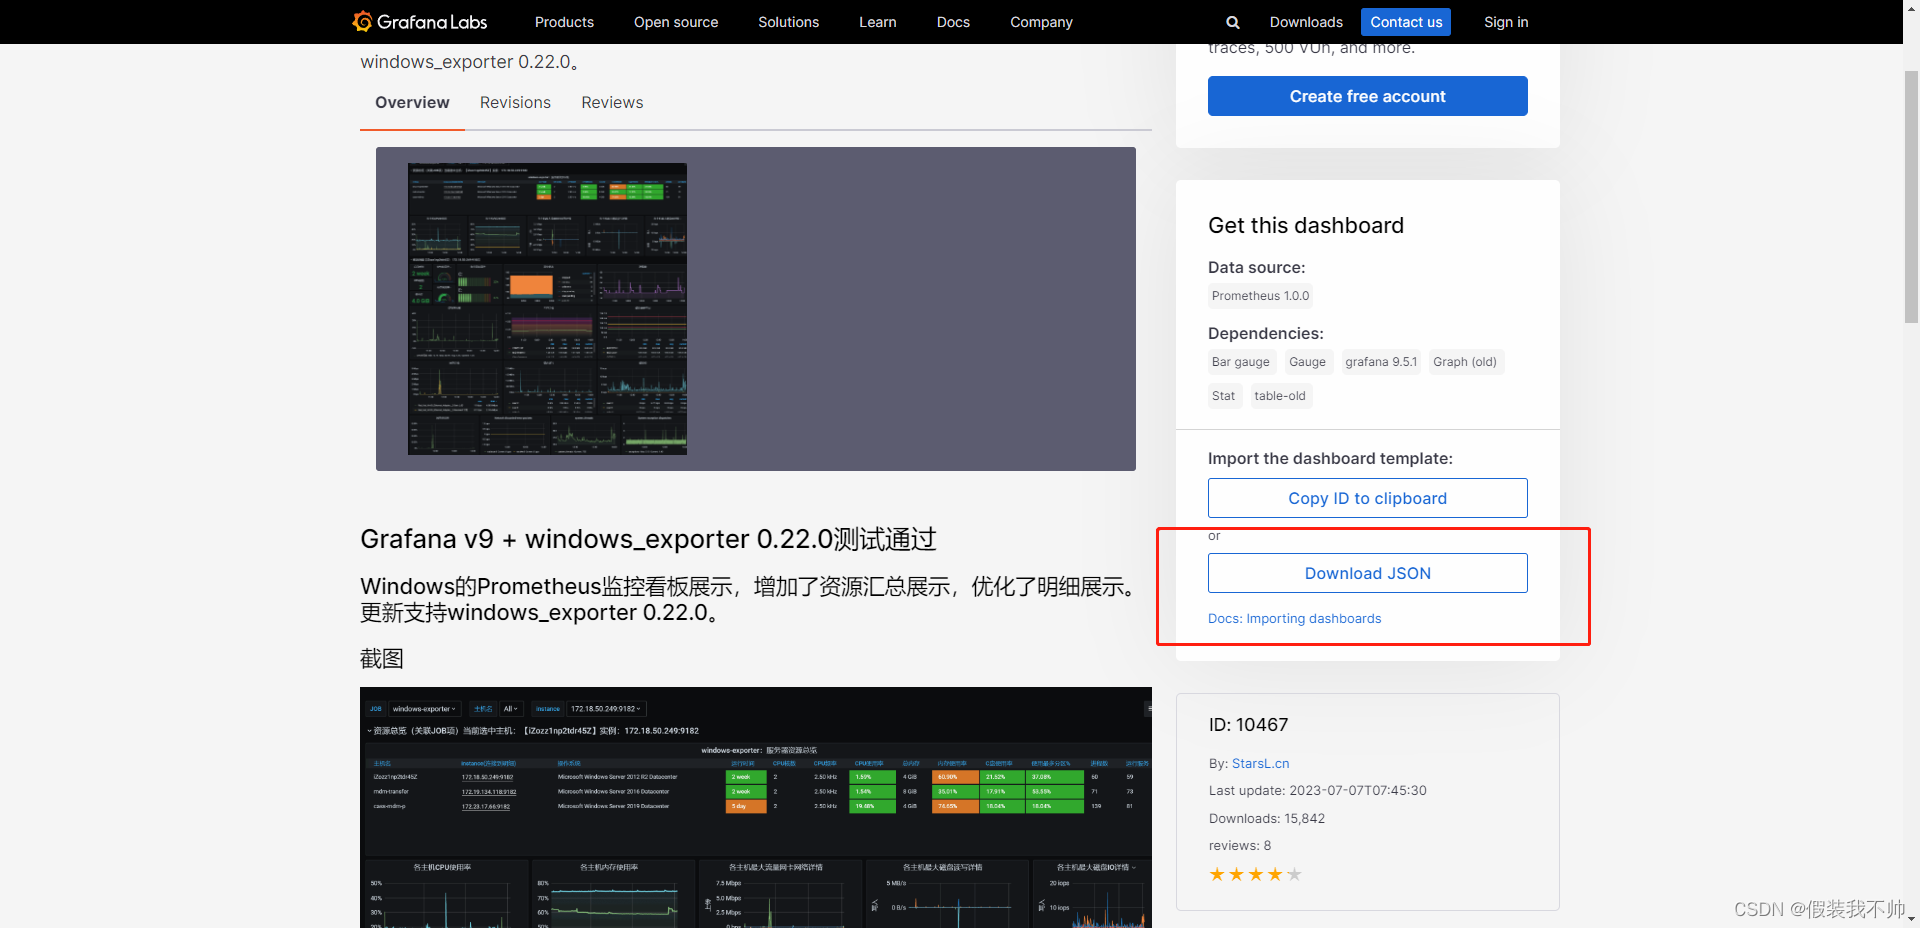
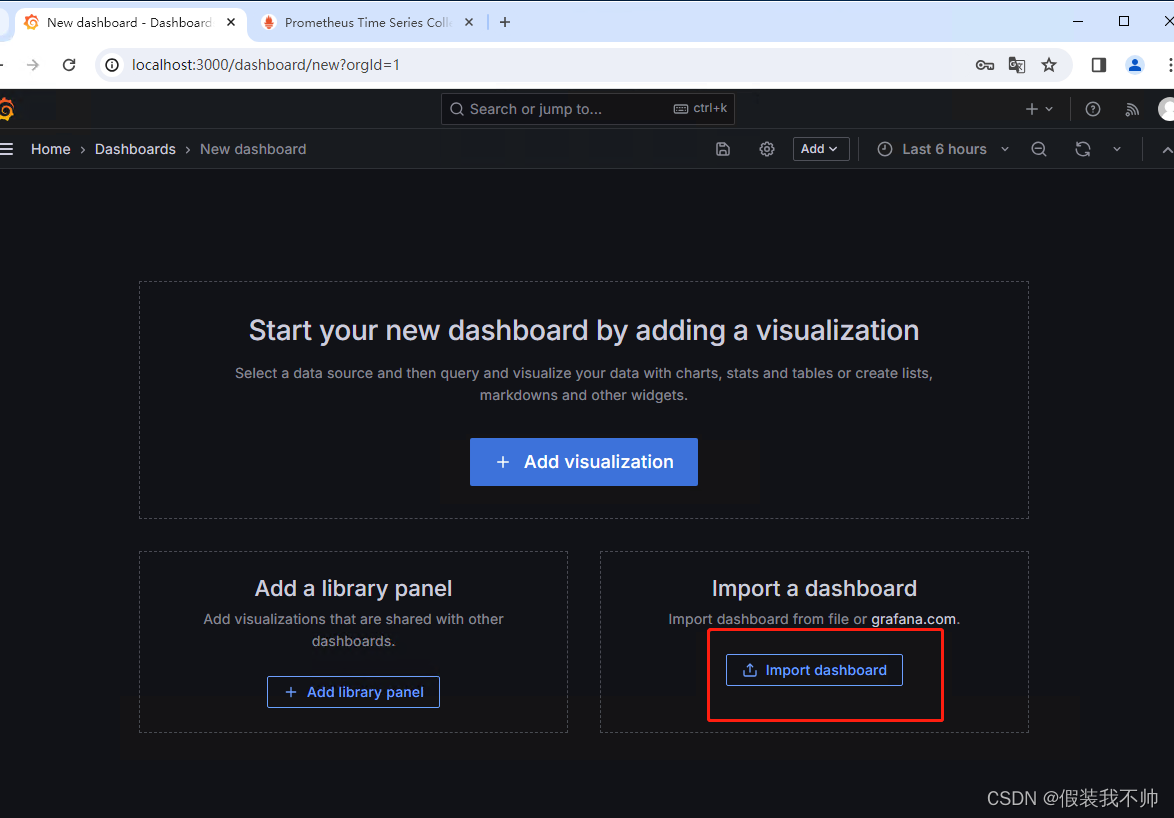
下载完成json模板之后进行导入


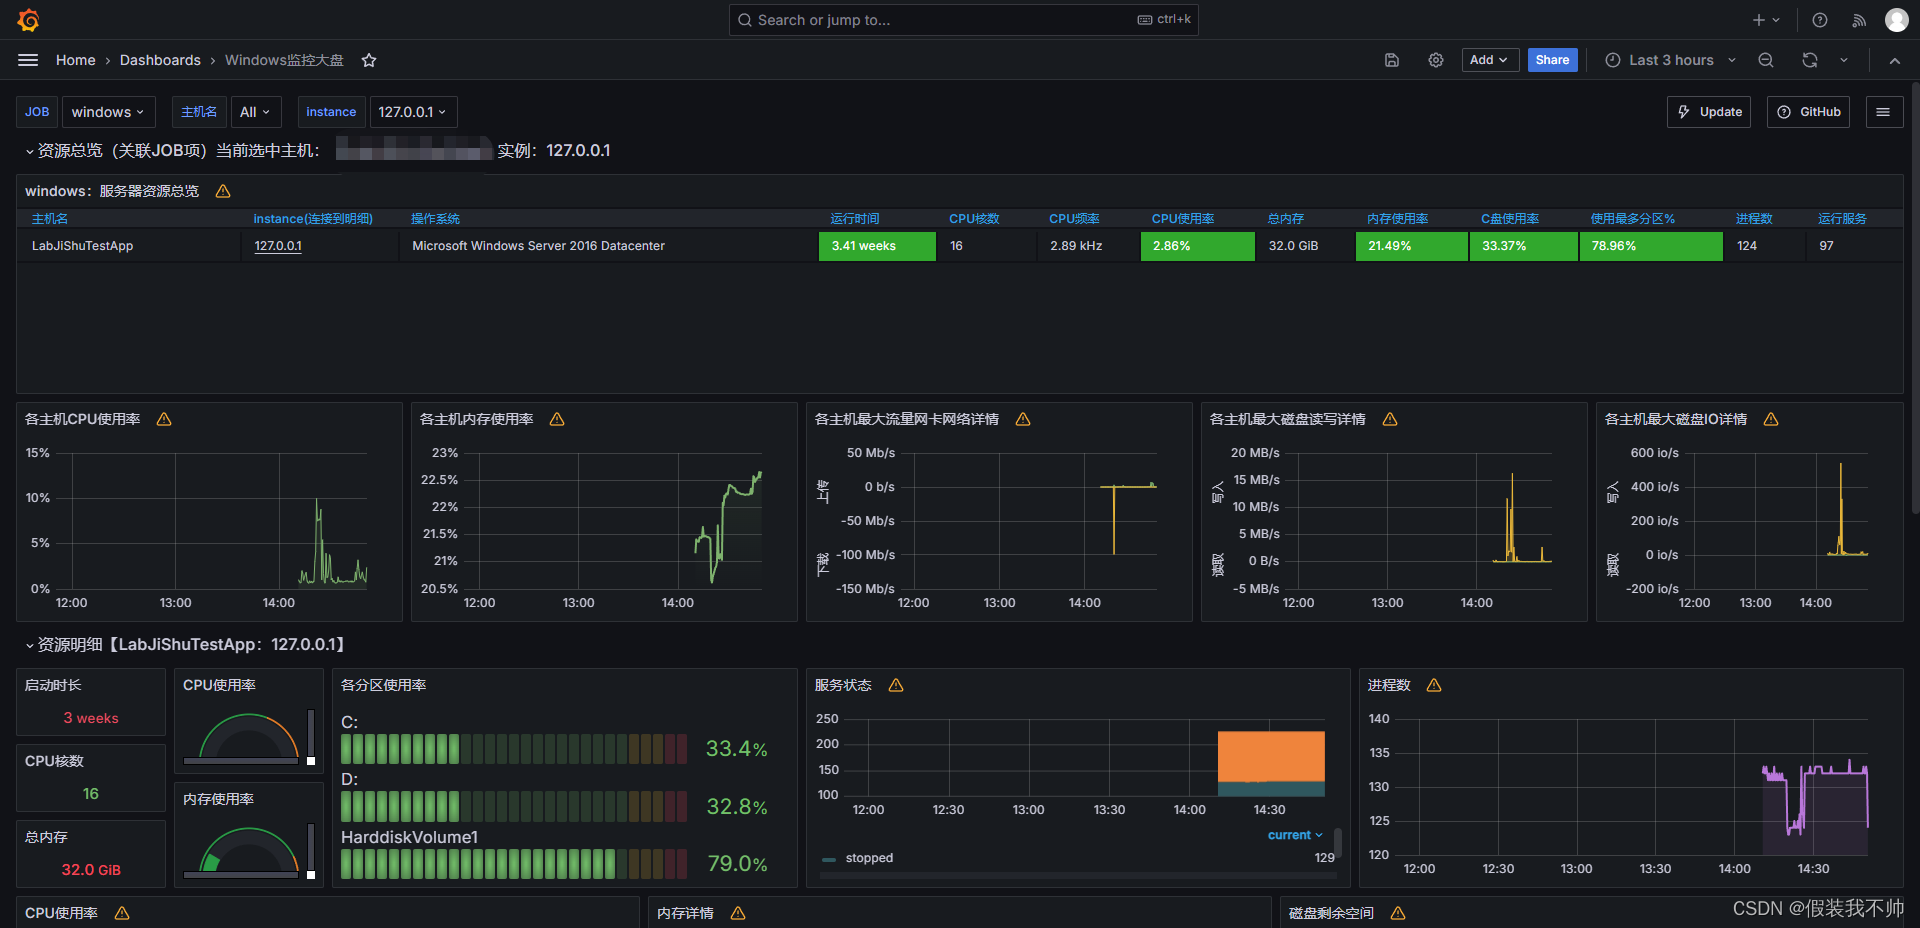
大盘配置完成
参考
参考

 统计代码耗时了,StopWatch 更优雅!)

基于TCN-CNN并行的一维故障信号识别模型)

![[LLM]大语言模型文本生成—解码策略(Top-k Top-p Temperature)](http://pic.xiahunao.cn/[LLM]大语言模型文本生成—解码策略(Top-k Top-p Temperature))


的机器人路径规划(提供Python代码))
 - 12.1-12.4)

)


)
