文章目录
- 1. 前言
- 2. 安装
- 2.1 在 Host 安装 `Arm Performance Studio`
- 2.2 在 ARM 目标平台安装 `gatord`
- 3. 使用
- 3.1 离线方式
- 3.2 在线方式
- 3.3 添加符号表
- 4. 参考资料
1. 前言
限于作者能力水平,本文可能存在谬误,因此而给读者带来的损失,作者不做任何承诺。
2. 安装
Streamline 分为两大部分:
gatordArm Performance Studio
gatord 运行于目标 ARM 平台,负责性能数据采样;而 Arm Performance Studio 运行于 Host (如 Windows/Linux/MacOS 等),负责性能采样数据分析。
本文以【运行于 Windows 主机 Arm Performance Studio + 运行于 ARMv8 平台的 gatord 】组合为例进行说明。
2.1 在 Host 安装 Arm Performance Studio
到 https://developer.arm.com/Tools%20and%20Software/Arm%20Performance%20Studio#Downloads 处下载 Arm Performance Studio 的 Windows 版本进行安装:
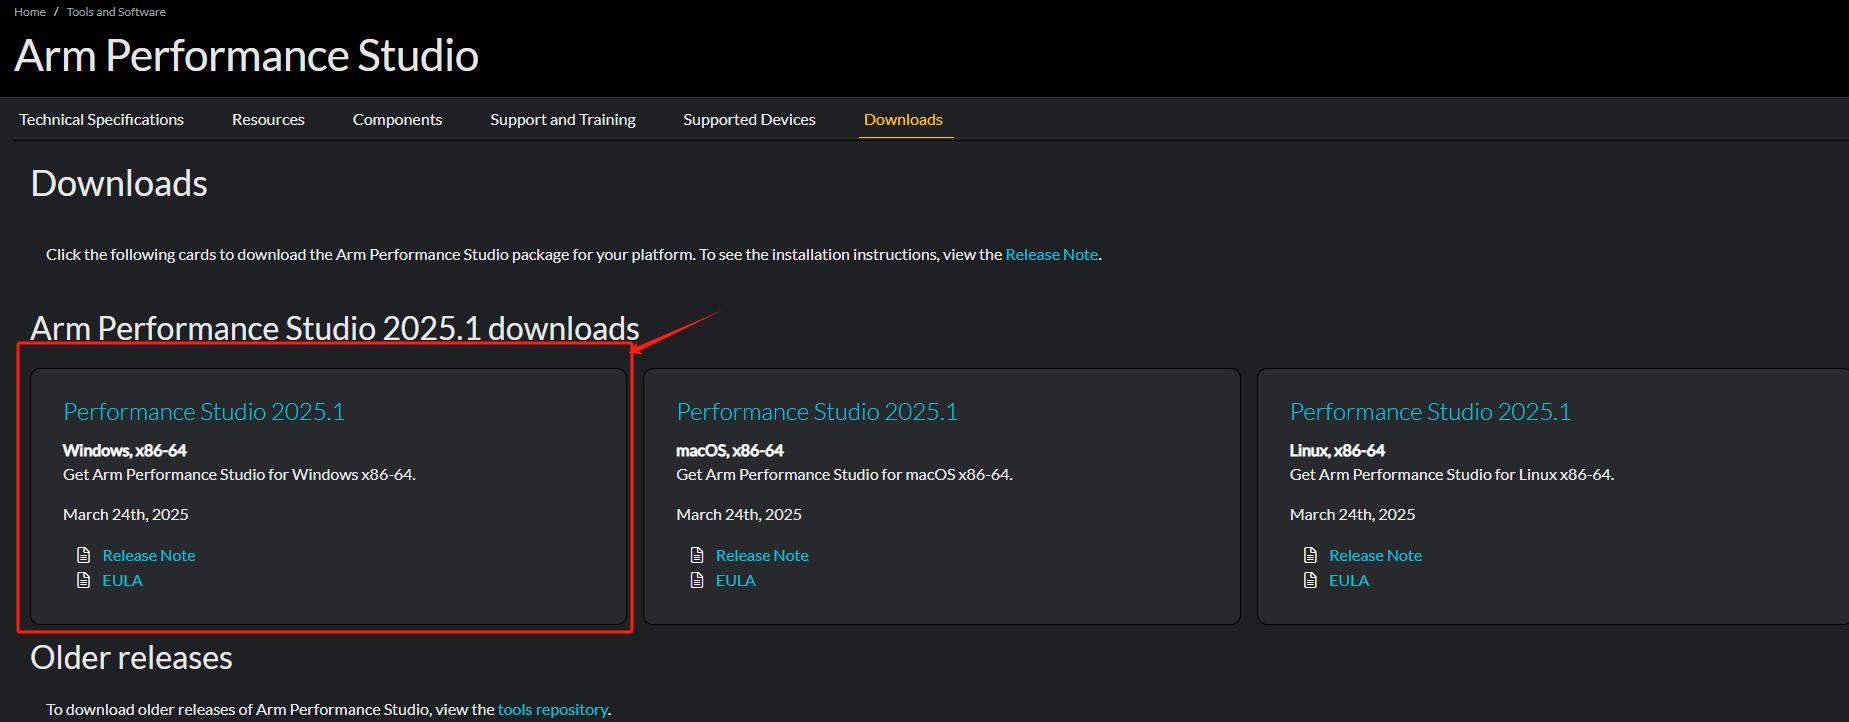
当然,读者也完全可以下载 Linux 或 macOS 版本进行安装,只是笔者用 Windows 版本进行演示。
2.2 在 ARM 目标平台安装 gatord
按 Set up your target 完成 gatord 运行环境的检验和安装。
首先检验 gatord 运行环境,Linux 需开启 CONFIG_PROFILING 配置:
# zcat /proc/config.gz | grep CONFIG_PROFILING
CONFIG_PROFILING=y
Arm Performance Studio 安装完成后,在路径 <install_directory>\streamline\bin\linux 包含有预编译的 gatord 程序,其源码在路径 <install_directory>\streamline\gator\daemon 下。将 gatord 程序拷贝到目标 ARM 平台,并增加可执行权限:
# chmod +x gatord
# ./gatord -h
Streamline Data Recorder v9.5.1 (Build d0e2706)
Copyright (c) 2010-2025 Arm Limited. All rights reserved.Streamline has 2 modes of operation. Daemon mode (the default), and local
capture mode, which will capture to disk and then exit. To enable local capture
mode specify an output directory with --output.* Arguments available to all modes:-h|--help                             This help page-c|--config-xml <config_xml>          Specify path and filename of theconfiguration XML. In daemon mode thelist of counters will be written tothis file. In local capture mode thelist of counters will be read from thisfile.-e|--events-xml <events_xml>          Specify path and filename of the eventsXML to use
......
如果预编译的 gatord 无法在目标 ARM 平台上运行,可到 gatord 处下载源码自行编译。
3. 使用
Streamline 的使用可以有两种方式:
1. 离线方式
2. 在线方式
离线方式是 gatord 进行性能数据采样,并将采样数据存放在 ARM 目标机器本地存储上,结束采样后再将性能数据采样文件拷贝到 Host (Windows/Linux/macOS),然后导入到 Arm Performance Studio 进行分析。
在线方式也是 gatord 进行性能数据采样,但不同于离线方式的是,性能数据采样实时的通过 ADB 或 网络传递给 Host (Windows/Linux/macOS) 一侧的 Arm Performance Studio 并存放,结束采样后 Arm Performance Studio 再进行分析。
接下来分别对离线和在线两种方式加以说明。不管是离线还是在线方式,都要先准备一个测试程序。按 Compile your application 编译一个应用程序,拷贝到目标 ARM 机器,并添加可执行权限。
3.1 离线方式
首先在目标 ARM 机器启动 gatord 和 应用测试程序:
# ./gatord -o profile.apc &
# ./test_app &
一段时间后,停止应用程序和 gatord :
# killall test_app
# killall gatord
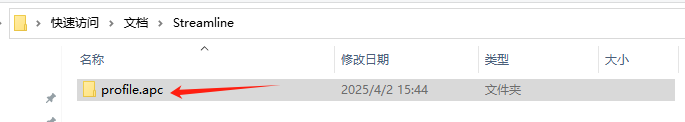
将采样数据文件夹 profile.apc 拷贝到 Windows 下 Arm Performance Studio 的指定目录下:
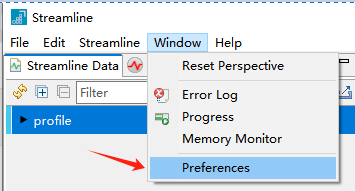
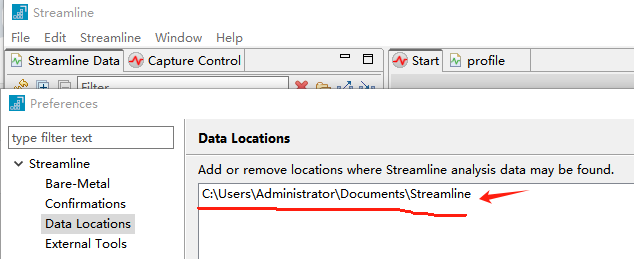
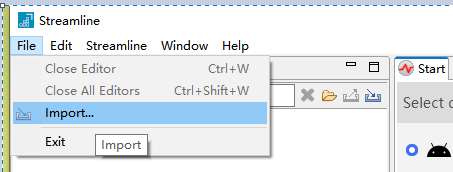
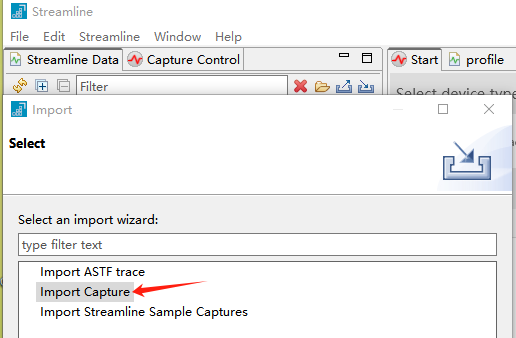
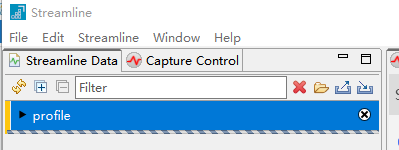
然后启动 Arm Performance Studio,并导入数据:
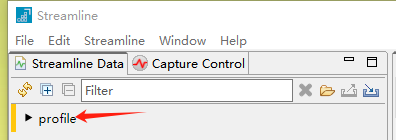
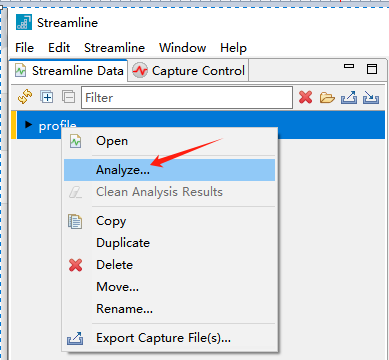
然后启动分析,这需要一点时间:
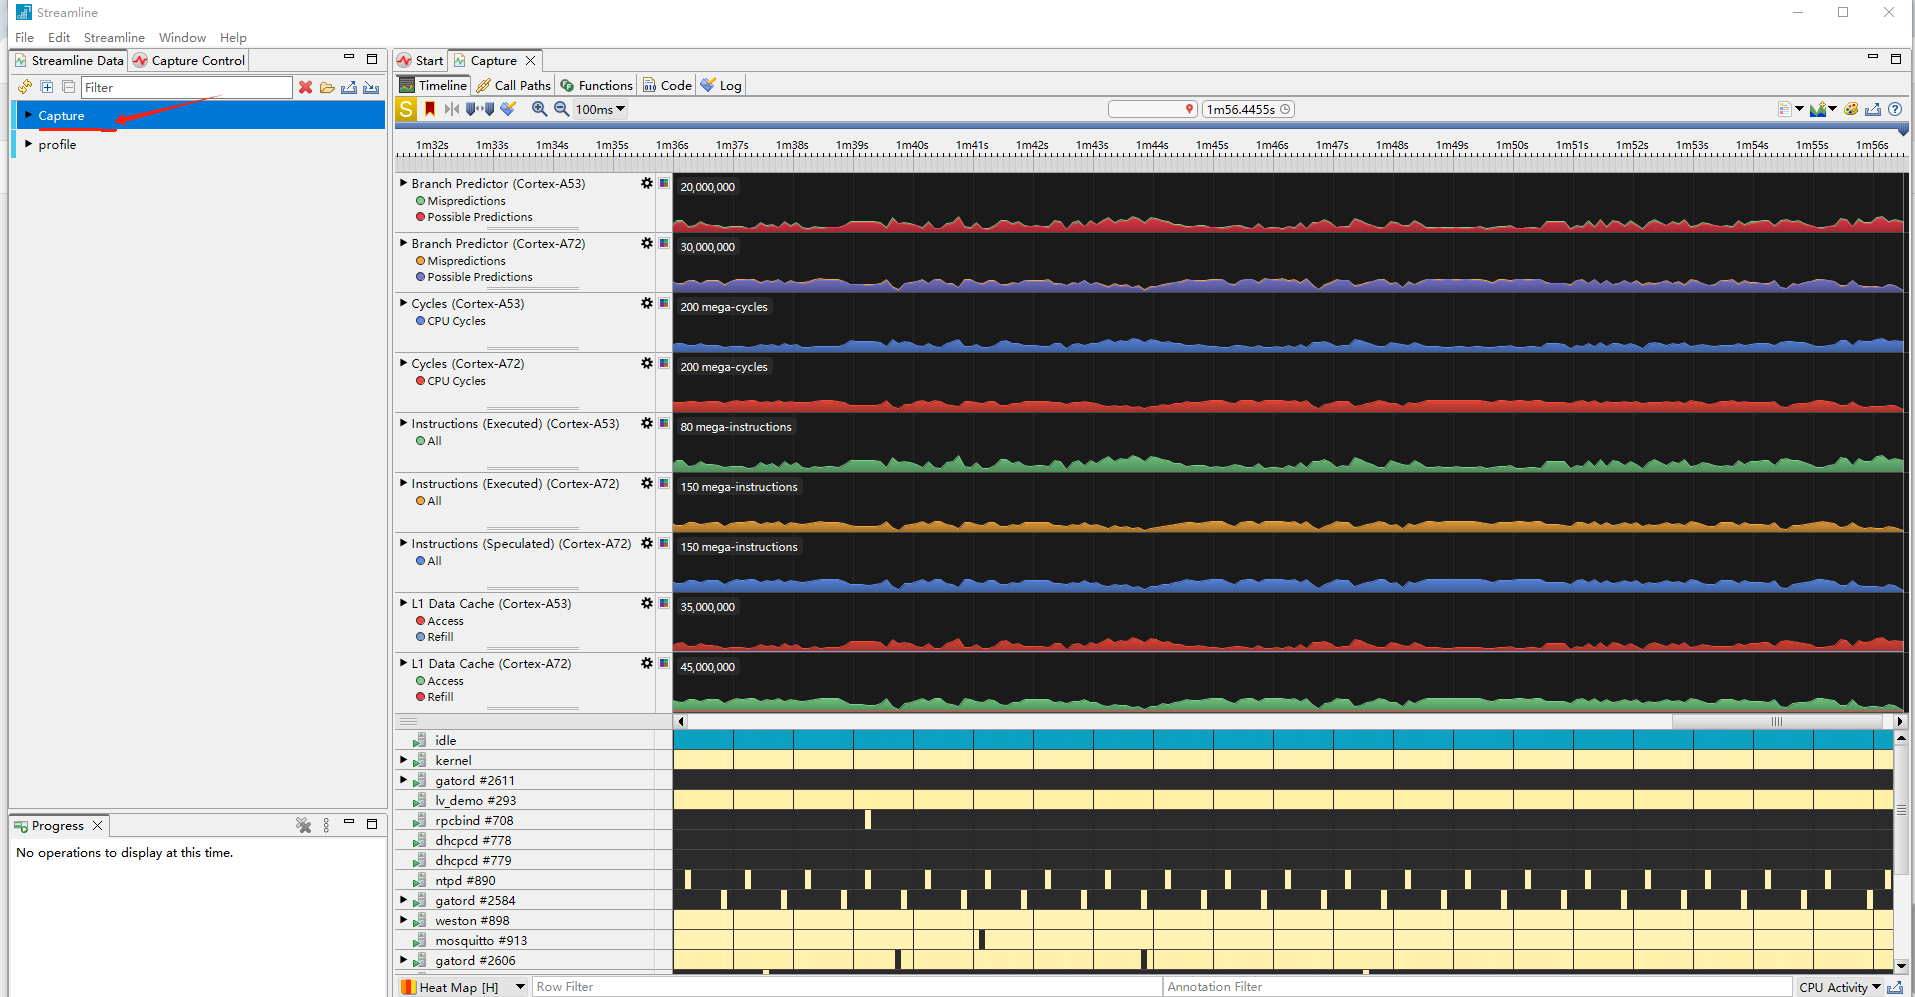
分析完成如下图:

可以标签栏 Timeline,Call Paths,Functions 等查看不同的分析数据,也可以选择指定进程的分析数据。
3.2 在线方式
# ./gatord &
[1] 2584
Streamline Data Recorder v9.5.1 (Build d0e2706)
Copyright (c) 2010-2025 Arm Limited. All rights reserved.Gator ready
# ./test_app &
在 Windows 下 Arm Performance Studio,选择 TCP 方式:
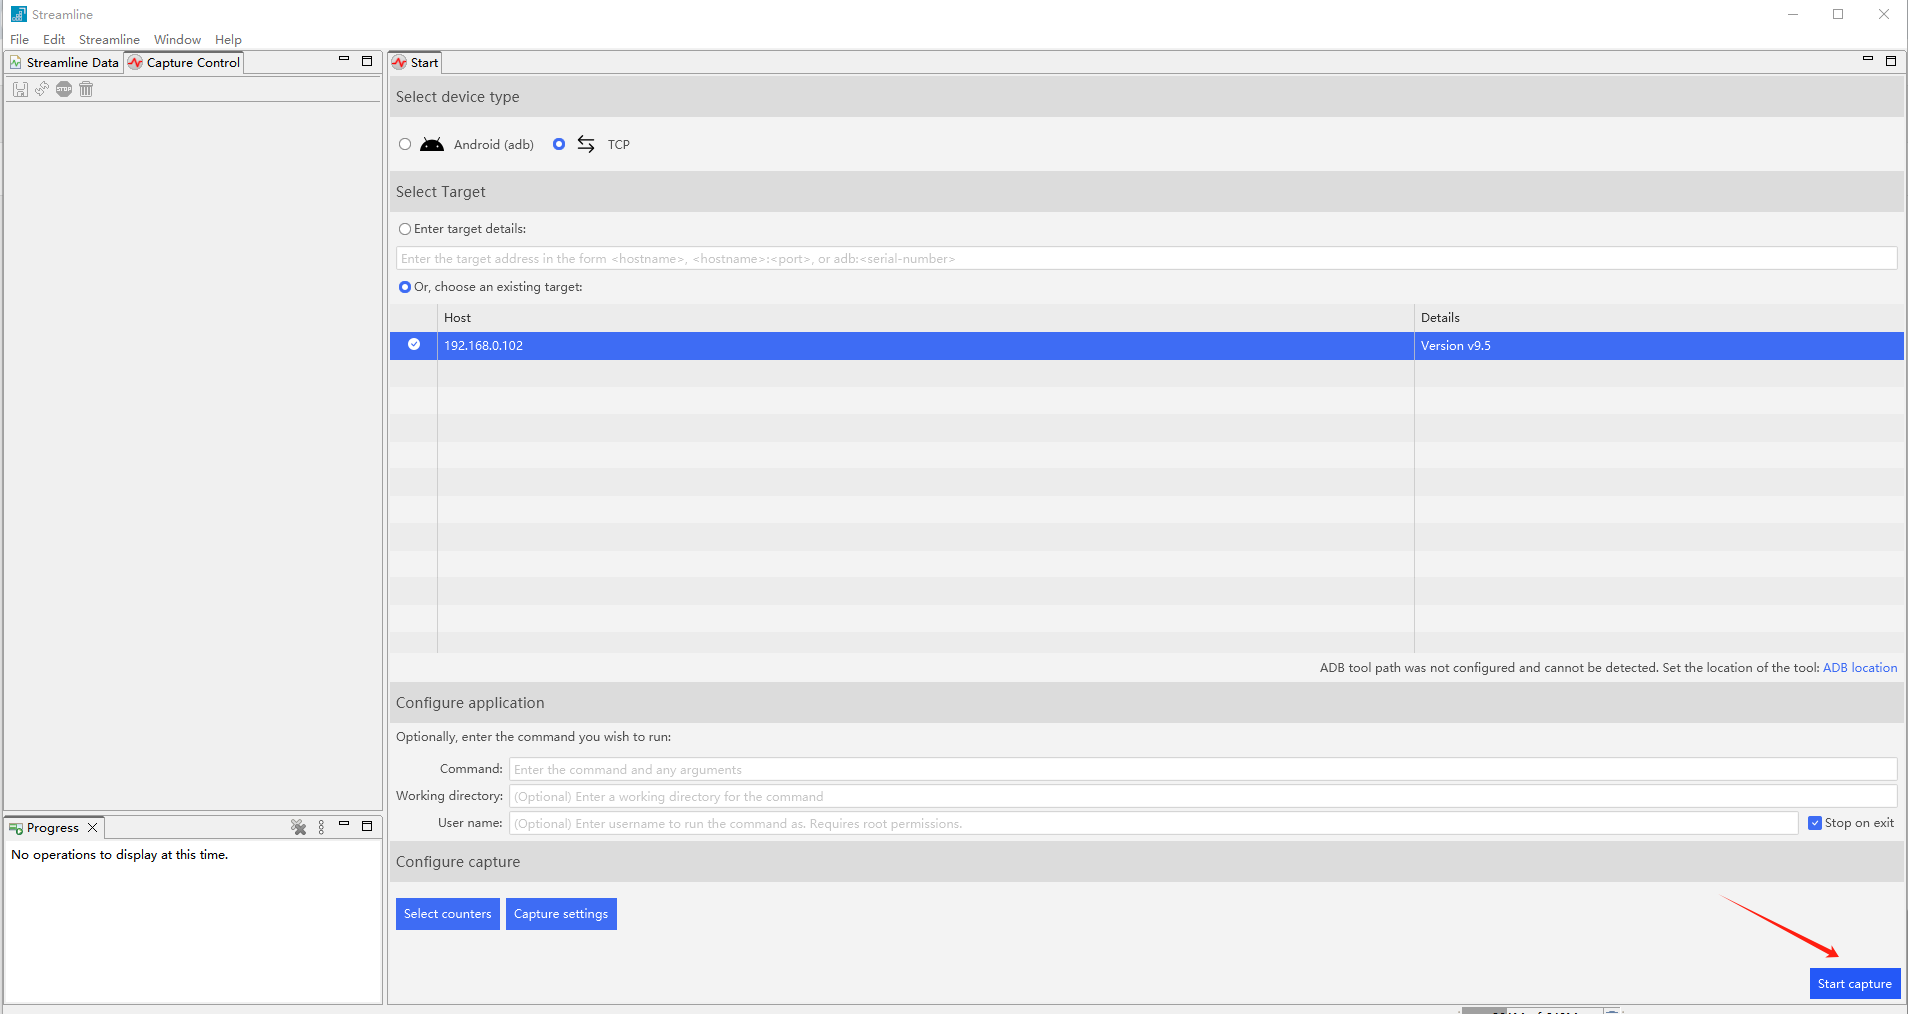
并点击 Start capture 按钮开始捕捉,出现如下画面:

停止测试应用程序和 gatord:
# killall test_app
# killall gatord

Arm Performance Studio 将自动停止捕捉并开始分析数据,分析完后的画面如下:
3.3 添加符号表
默认解析是看不到任何符号信息的,要按需导入。在采样数据上点击右键:
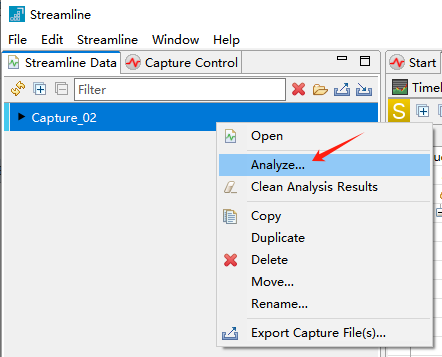
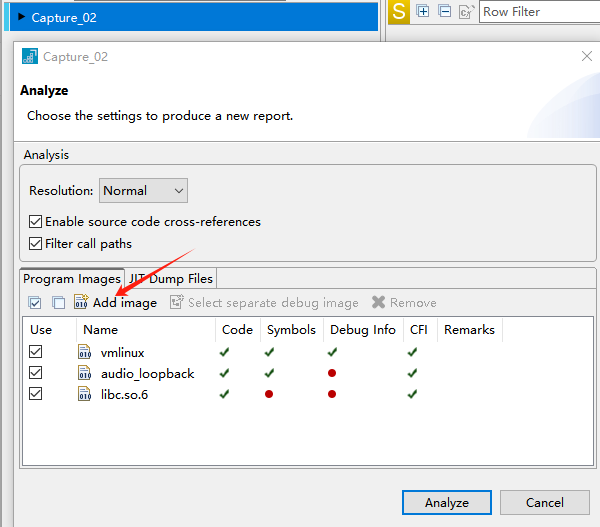
点击按钮  添加需要的符号文件,如上图中的
 vmlinux 等,然后点击 Analyze 按钮,分析后的数据就可以看到符号信息了:

Streamline 功能很多很强大,更多关于 Streamline 的用法,可参考 ARM 官方文档 。
4. 参考资料
[1] Arm Streamline Target Setup Guide for Linux
R

)
深度解析)


![[ISP 3A ] AE的常用算法分析](http://pic.xiahunao.cn/[ISP 3A ] AE的常用算法分析)

)


